SNMP is one of the most popular protocols for monitoring bandwidth on switches, routers, firewalls, and many other kinds of networking gear. If you dig into the details of how SNMP works, things can get complicated, especially until you absorb new terminologies like OIDs, MIBs, protocol data units, traps, and variable bindings.
FrameFlow hides all of the complicated parts of SNMP and lets you quickly and easily get the bandwidth data that you need. In this tutorial, we'll show you how to quickly set up bandwidth monitoring for a switch.
To view this tutorial in video format, see our SNMP Bandwidth tutorial video.
If you haven't already, add one or more of your switches and routers to FrameFlow using the Network Devices section. Just right-click on a folder and choose the "Add Network Device" option.
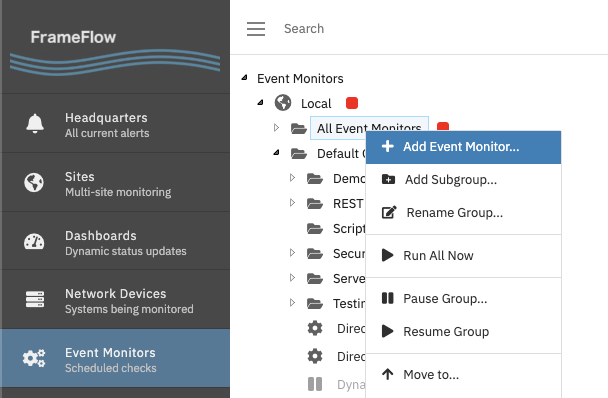
Now, in the Event Monitors section, right-click on the Default Group and select the "Add Event Monitor" option. In the filter box, type "SNMP" to find all of the SNMP-based event monitors and select the "SNMP Bandwidth Event Monitor" option.
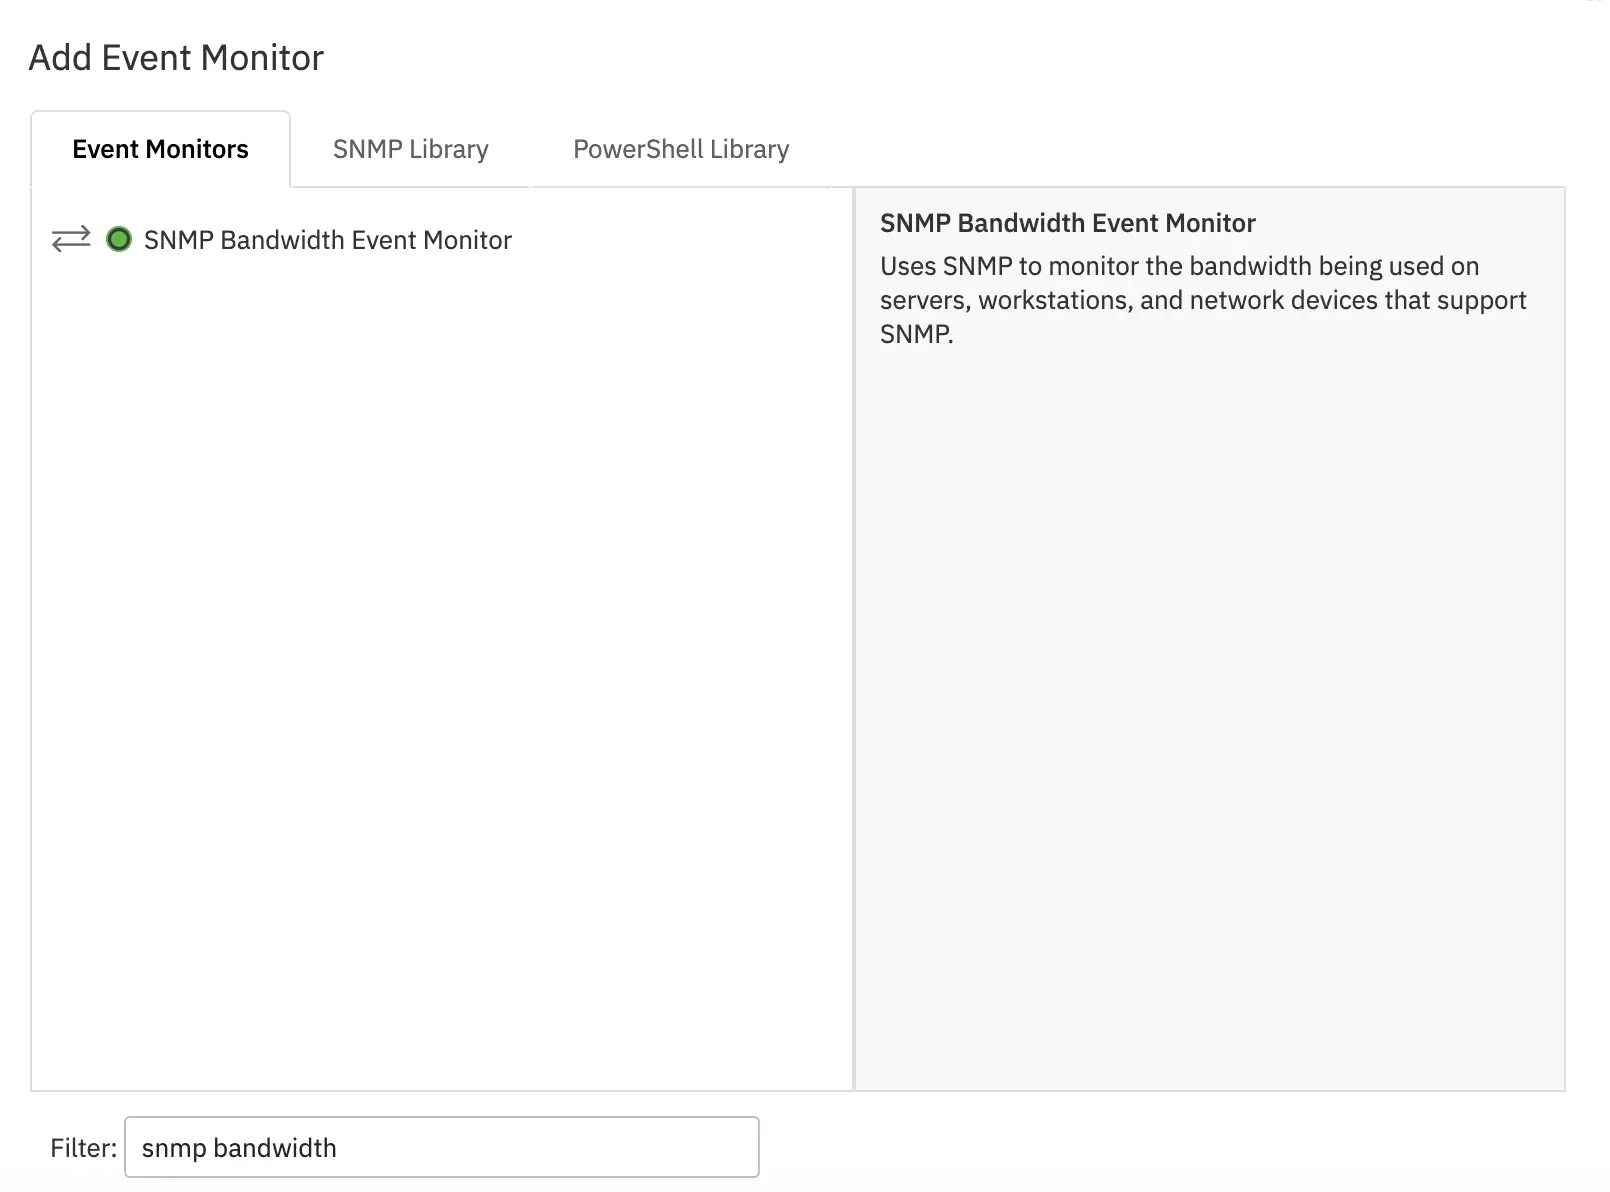
After you click OK, a new SNMP Bandwidth Event Monitor will be created and you can select the settings you want to use with it.
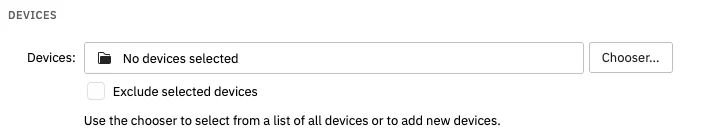
First, select your network devices. Use the Chooser button to select one or more switches and/or routers that you would like to monitor.
Next, in the SNMP Settings section, you can select an SNMP profile if you have already created one. We'll go over the best practices for SNMP profiles in a separate tutorial. If you have not yet added any profiles, select the option labeled "-- Custom --" which will let you enter settings specifically for this new event monitor.
Use the "SNMP Version" dropdown to select "SNMPv2c". This is important. It is possible to use SNMPv1 for bandwidth monitoring but it has several limitations that are fixed in SNMPv2c and later. For more information about SNMP versions, see our blog post SNMPv1, SNMPv2c, SNMPv3: All About SNMP.
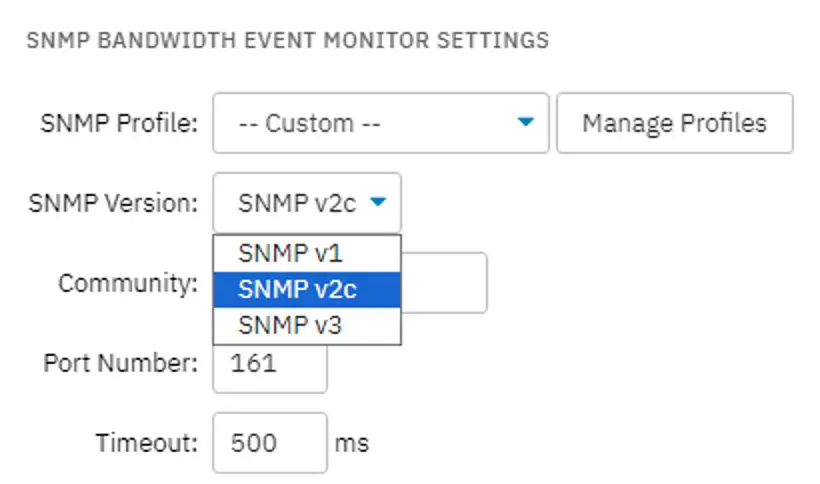 Selecting the SNMP Version to Use
For the rest of the settings, leave them with their default values. Later in this tutorial, we'll go back and learn a bit more about how we can use the other options.
Press the "Save Changes" button. This will create the new SNMP Bandwidth Event Monitor and it will automatically start its first run. By default, it will run again every 10 minutes but that schedule can be adjusted later.
To see the monitoring results, click on the Status tab, scroll down to the Devices section and use the plus icon to expand the results for one of your devices. You'll see something like the following:
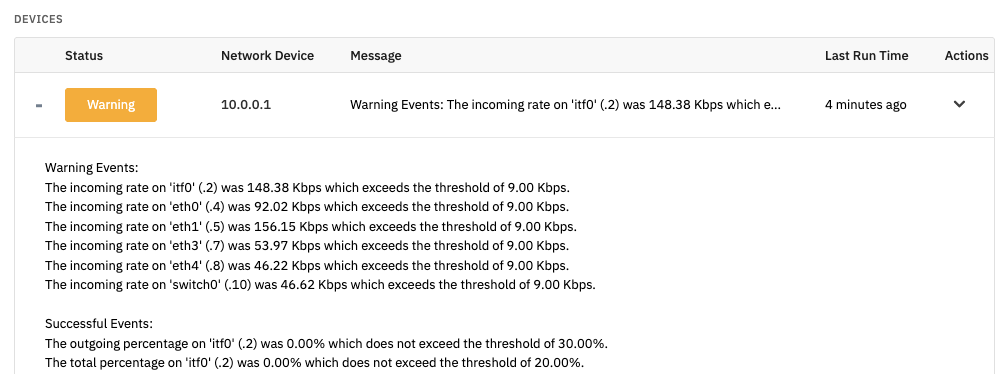
Each interface will be listed, along with their incoming, outgoing, and total bandwidth rates.
To see the results in a graphical format, scroll back to the top and select the Graphs tab. There you will find one entry for each device that was checked by the event monitor. Use one of the Data Points dropdown boxes to select the values you'd like to see.
At first, there will not be much data because the event monitor has only run a few times. You can use the Action menu to run the event monitor a few times in a row and that will generate more data points. Your event monitor will collect data each time it runs and over time you'll start to see longer-term trends that you can use for monitoring, capacity planning, and more.
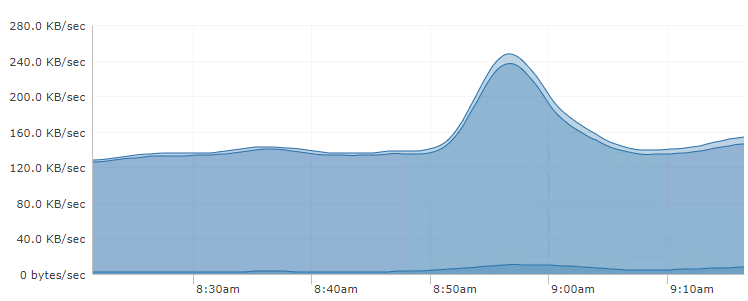
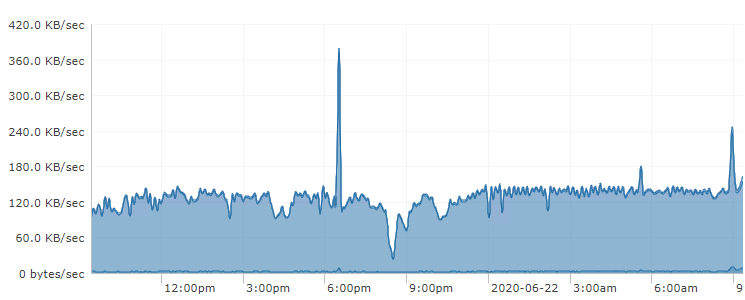
Short-term and Long-term Bandwidth Results
Now that you've started collecting bandwidth data from your devices, you can configure alerts to get notifications about unexpected conditions. For example, you can set thresholds to get alerts when bandwidth rates exceed thresholds that you define.
You can set thresholds at multiple levels corresponding to info, warning, error, and critical status levels. In another tutorial, we will show you how you can configure different kinds of alerts for different status levels and implement alert escalation.
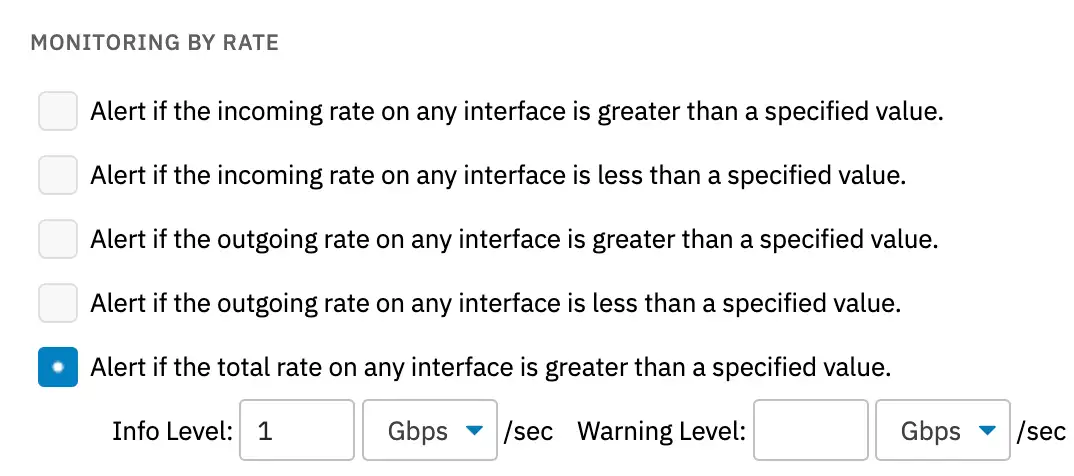
Defining Bandwidth Monitoring Thresholds
The SNMP Bandwidth Event Monitor lets you specify both high thresholds and low thresholds. High thresholds are useful for detecting when a link is approaching its capacity. Low thresholds are useful for detecting outages and unanticipated routing changes.
For example, in a busy office environment, certain links are guaranteed to see sustained high traffic rates. If they drop to very low levels this can indicate an outage or issue, perhaps at an upstream carrier. Monitoring with low thresholds can detect these conditions.
The SNMP Bandwidth Event Monitor has more options for you to explore. For example, you can apply filters to only monitor physical or virtual interfaces, you can skip interfaces that have never shown traffic, you can choose to monitor only interfaces that have been marked as favorites, and much more. We are working on deep-dive tutorials for each of these subjects so keep an eye out for those.
In this tutorial we showed you how to create an SNMP Bandwidth Event Monitor, select the devices it will monitor, choose thresholds for alerting, and then start collecting bandwidth data. With FrameFlow, SNMP monitoring is easy. With just a few points and clicks, you can be collecting bandwidth data from all of your switches, routers, firewalls, and other network equipment. Check out our Bandwidth Event Monitor for other bandwidth monitoring needs. Refer to our SNMP Bandwidth Event Monitor reference guide for more documentation on this event monitor.
More IT Monitoring Features