The Performance Counter Event Monitor watches the Windows Performance Counters that you select and alerts based on the values it detects. All Windows installations have a default set of performance counters installed. FrameFlow can monitor these, as well as the built-in performance counters that most applications install on their own. In this tutorial, we will be going over how to select, monitor, and set alerting parameters for any counter you choose.
In FrameFlow's Event Monitors section, right-click on "Default Group" and select "Add Event Monitor". In the window that appears, select the Performance Counter Event Monitor. Use the chooser button to select the network device you would like to monitor.
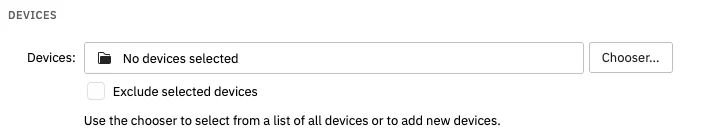 Selecting the Device to Monitor
This event monitor can monitor multiple counters at once but gives you one option by default. If you happen to know the object name, counter name, and instance, add them directly. In the chooser, under "Network Device", type in the name of the one you selected earlier, and choose the authentication profile you would like to use when running this monitor.
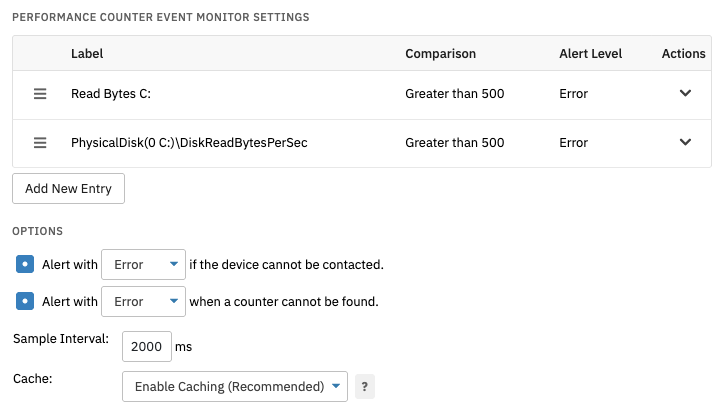 Monitoring Multiple Performance Counters
Next, choose the performance counter object you require and hit next again. Retrieving the list of counters within the counter object may take a few minutes. Once it's loaded, choose your counter.
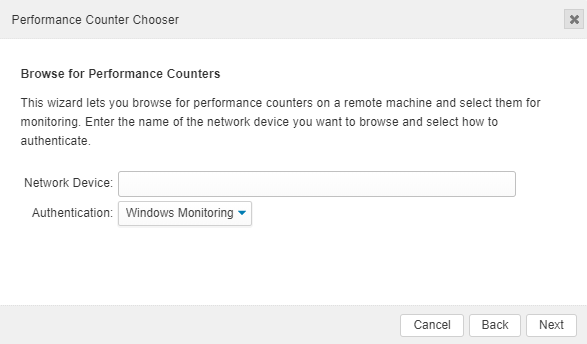 Searching for Counter Objects and Counters
Once you've done this, you can adjust the alerts according to the counter you have chosen. Each counter is different and is used to measure different things, so the options are flexible. Under "Value", enter the value that will be compared with what the event monitor detects. You can specify if you would like alerts if the detected value is greater than or less than the value you entered. In the "Data Type" menu, select the type that best matches the selected counter. The type of data you choose will determine how the value is presented in alerts and graphs. Then, select the status level for the alerts that will be generated when the comparison check fails.
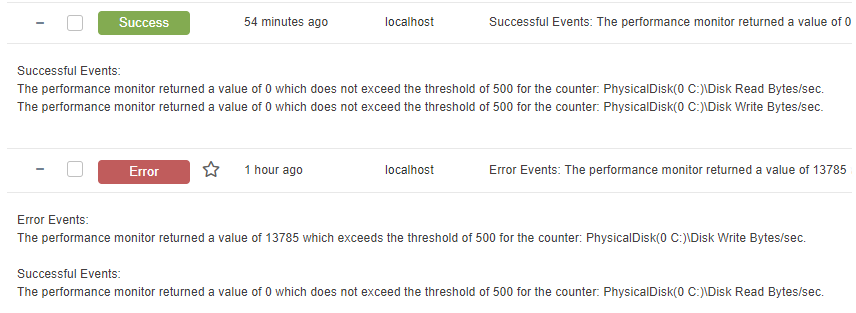 Disk Read Space Performance Results
You can leave the sample interval and the cache at their default settings unless FrameFlow's tech support team has told you otherwise. Under Authentication, select the account you chose earlier. At this point, you can run your monitor and begin collecting values. The results of your monitoring can be found in the History and Graphs section of the event monitor.
In this tutorial, we walked through the steps needed to select a performance counter to monitor. We also talked about how to how to set values to be used for alerting. We explained how to run the event monitor once it's set up and where to view your results. Refer to our Performance Counter Event Monitor reference guide for more documentation on this event monitor. More tutorials are on the way! Stop by the Features page later and see what we've been working on.
More IT Monitoring Features