FrameFlow's Best SNMP Monitoring Features
FrameFlow has eight dedicated SNMP event monitors and several more SNMP-focused features baked into our interface. Here, we'll discuss the top 4 most useful SNMP monitoring tools we offer and link to setup tutorials for each applicable feature. Read on to find out more!
1. SNMP Bandwidth Event Monitor
FrameFlow's SNMP Bandwidth Event Monitor is packed with options for monitoring bandwidth on switches, routers, firewalls, and many other kinds of networking gear. It hides all of the complicated parts of SNMP and lets you quickly and easily get the bandwidth data that you need.
As always, you can set thresholds on metrics like incoming/outgoing bandwidth and total switch rate and even receive alerts based on bandwidth percentages. These alerts help you keep tabs on bandwidth usage across all connected networking gear, allowing you to oversee all your SNMP-based devices in one place.
In the Graphs tab of your SNMP Event Monitor, you can view short- and long-term SNMP bandwidth trends that you can use for monitoring, capacity planning, and more.
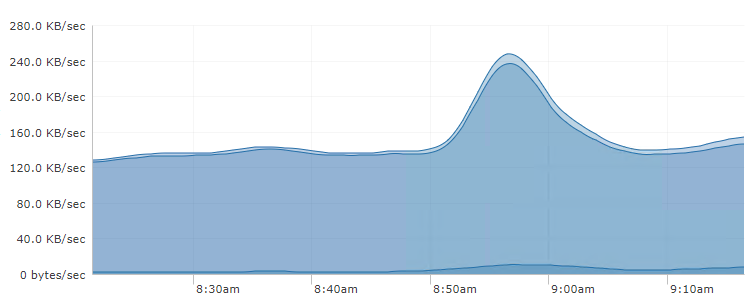
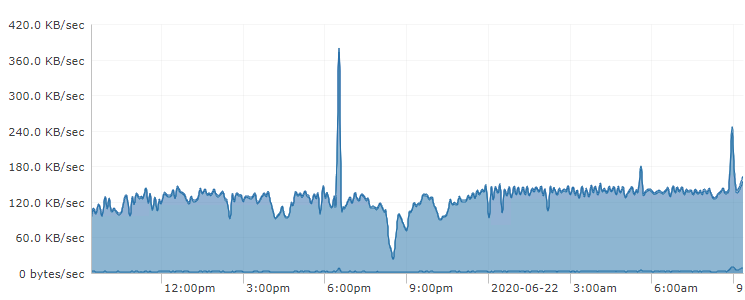
Short and Long-term SNMP Bandwidth Graphs
2. 95th Percentile Graph
Internet service providers use burstable billing to determine how much to charge their clients based on bandwidth usage. Burstable billing lets you briefly exceed a specified threshold without incurring the charges associated with those higher rates of bandwidth usage. Most ISPs charge for the 95th percentile only, allowing you to exceed your regular rates 5% of the time.
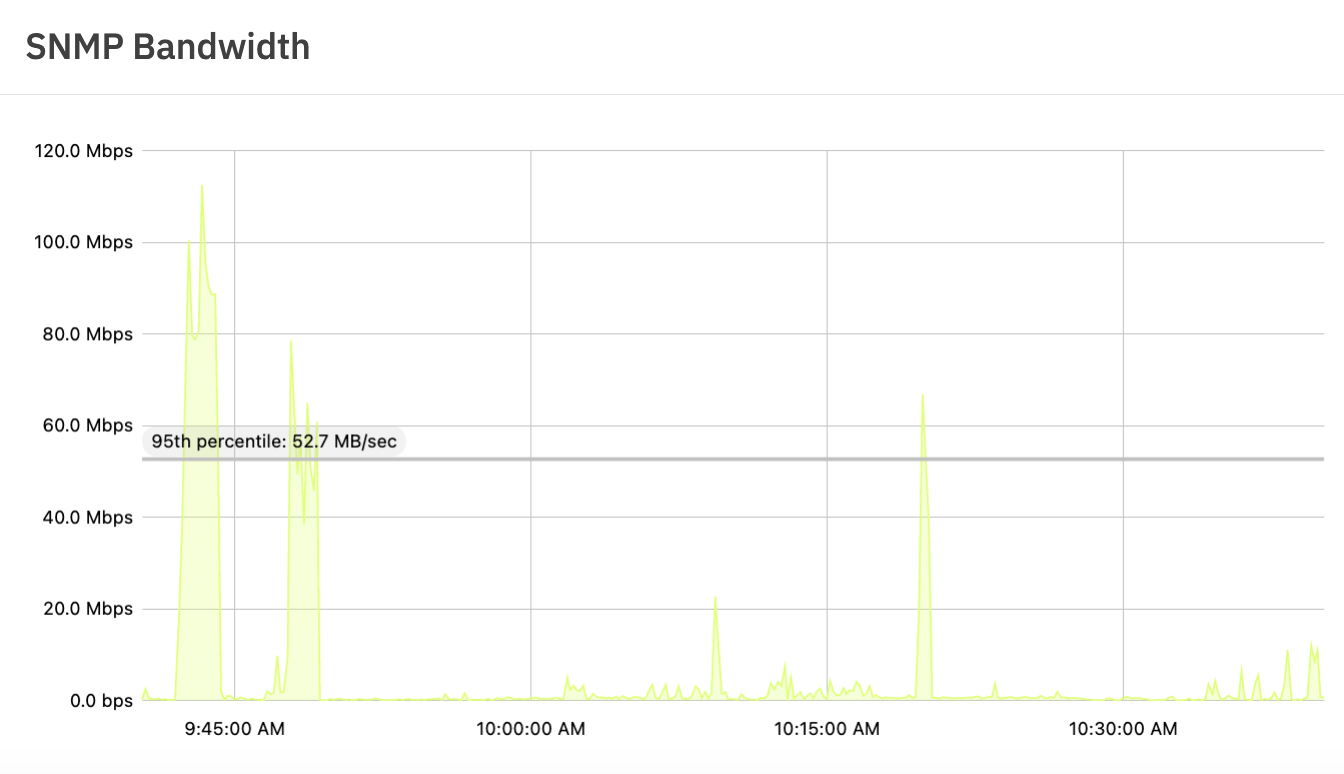 Graph with 95th Percentile Line
For your SNMP bandwidth graphs, FrameFlow offers a built-in 95th percentile line that lets you track your usage based on this metric. It helps you keep your rates below a target number and also helps you predict your monthly bill.
 95th Percentile Line Option in Graph Options Chooser
3. SNMP Interface Event Monitor
SNMP interface monitoring is an integral aspect of SNMP monitoring. If you need a tool that does it well, FrameFlow is well-equipped for the job. Our SNMP Interface Event Monitor watches the status of your SNMP interfaces by keeping tabs on admin and oper statuses, detecting changes in connections, and monitoring error rates.
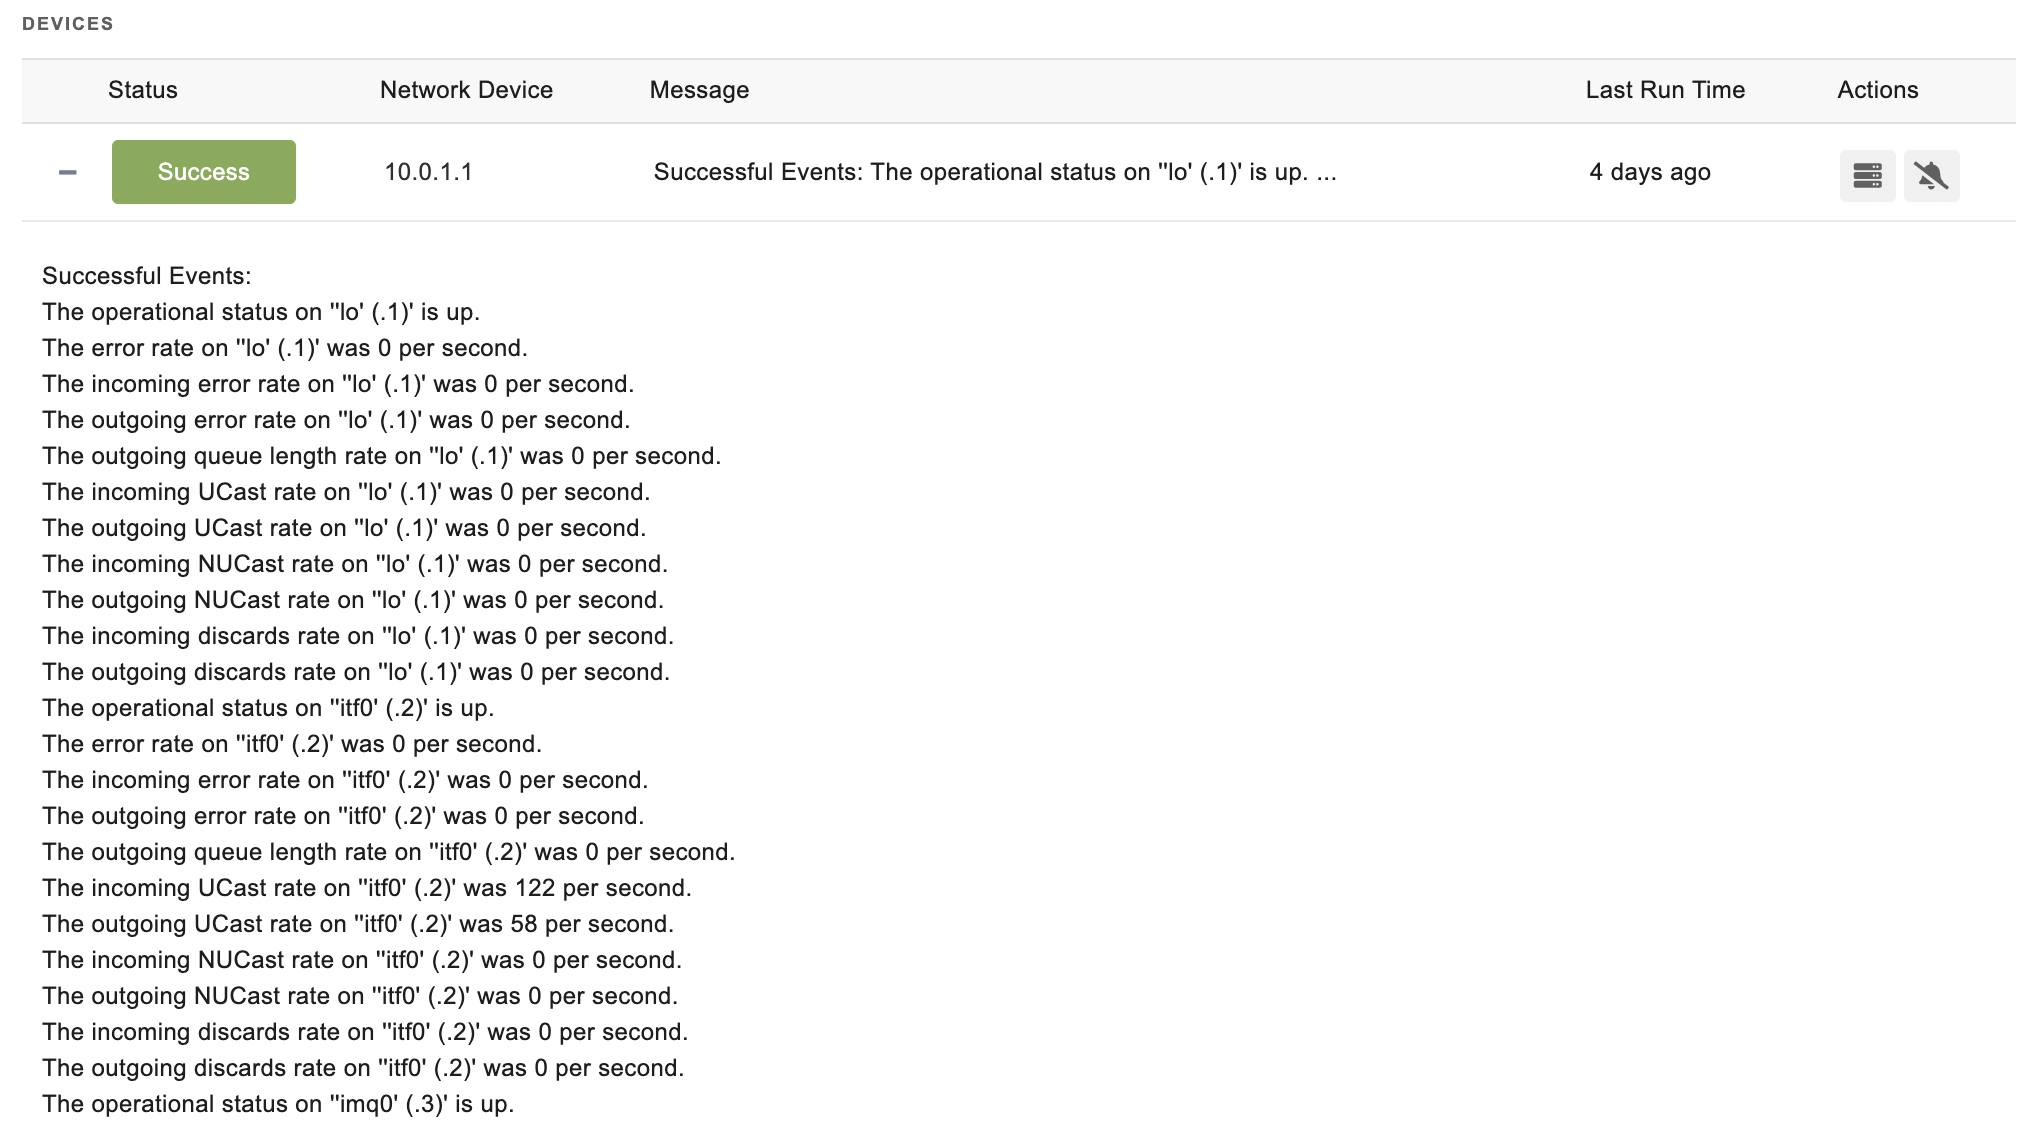 SNMP Interface Sample Output
Learn more about SNMP interface monitoring with FrameFlow here.
4. FrameFlow's Free SNMP Browser
FrameFlow's SNMP browser is free to use for FrameFlow customers and non-customers alike. With it, you can scan and detect all values associated with your SNMP-enabled devices. With a tree-based display and robust filtering, you can quickly find the values you are looking for and learn a lot about SNMP and your devices along the way.
 Free SNMP Browser
From there, FrameFlow customers can pick and choose important SNMP values and automatically create an SNMP Event Monitor with those values pre-loaded and ready to monitor.
 Automatically Creating an SNMP Event Monitor
We also have an SNMP MIB manager, which helps you ensure that each SNMP value has the correct corresponding MIB file. This is important because almost every aspect of SNMP monitoring depends on these values.
Summary
FrameFlow is your one-stop shop for all things SNMP monitoring, from our specialized event monitors to our handy tools like the 95th percentile line and our SNMP browser. This article taught you a bit about our four most popular SNMP monitoring solutions, but that's just the tip of the iceberg. Check out our Features page to learn about all our capabilities.
Are you new to FrameFlow? Download now to take it for a spin for free for 30 days and start taking advantage of its enterprise IT monitoring features.