FrameFlow's Visualization Tools
FrameFlow's IT monitoring software does a lot of work behind the scenes to help keep your network flowing properly, but it's sometimes useful to see that work in action. From our world-class graphing features to tools that help you visualize your entire monitoring configuration from the top down, our visualization tools are top-notch. This article will break down the top visualization tools we have to offer.
1. Status Graphs
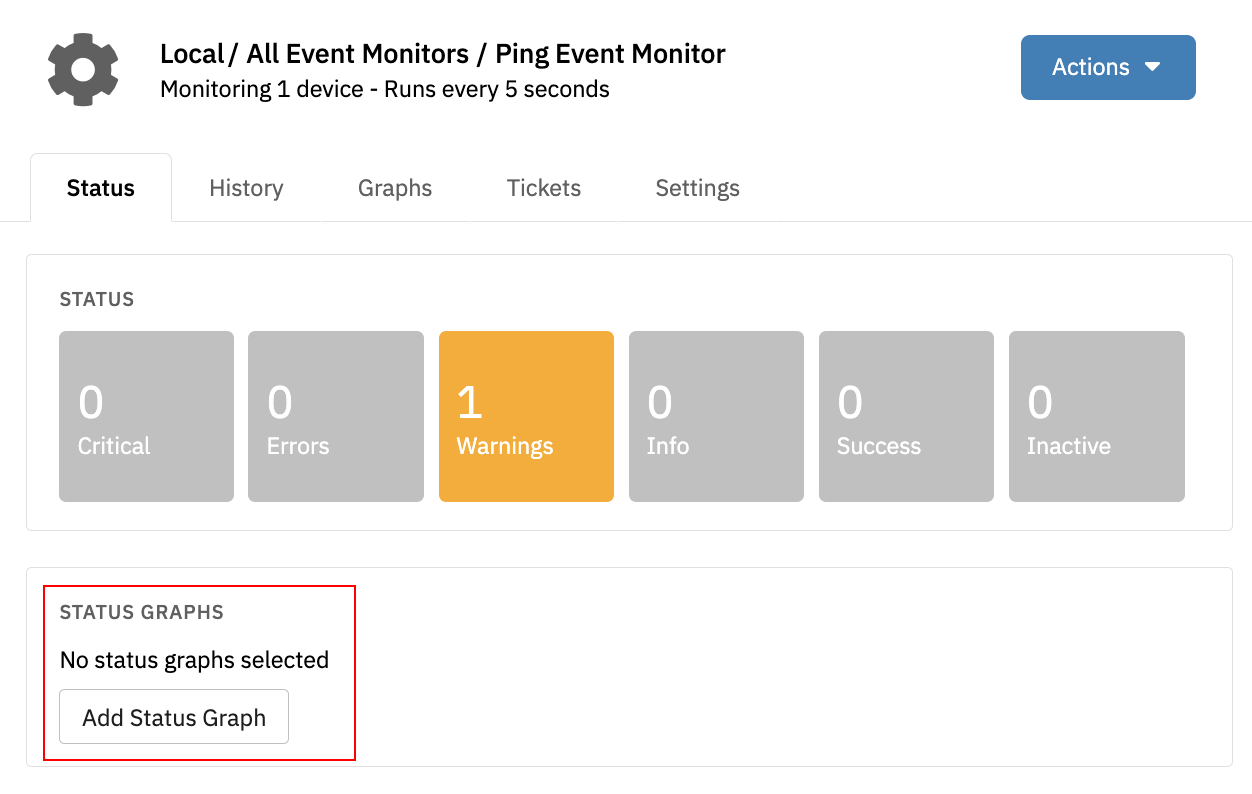
FrameFlow's status graphs are available for network devices and event monitors alike. Status graphs display the current status of your devices and monitors on their Status tab, letting you easily view how your assets are faring at a glance. Just click "Add Status Graph" on the Status tab of a network device or event monitor to get started.
 Status Graph Section for Event Monitor
From there, choose the layout of your status graph(s) and the height of your layout using the chooser. Then, choose the device, data point, and style that will be used to build your status graph. Once you've configured these settings to your liking, click "Okay" to implement your new status graph. To delete a status graph, just click the dropdown menu and select "Remove".
 Status Graph Section for Event Monitor
2. Graph Explorer
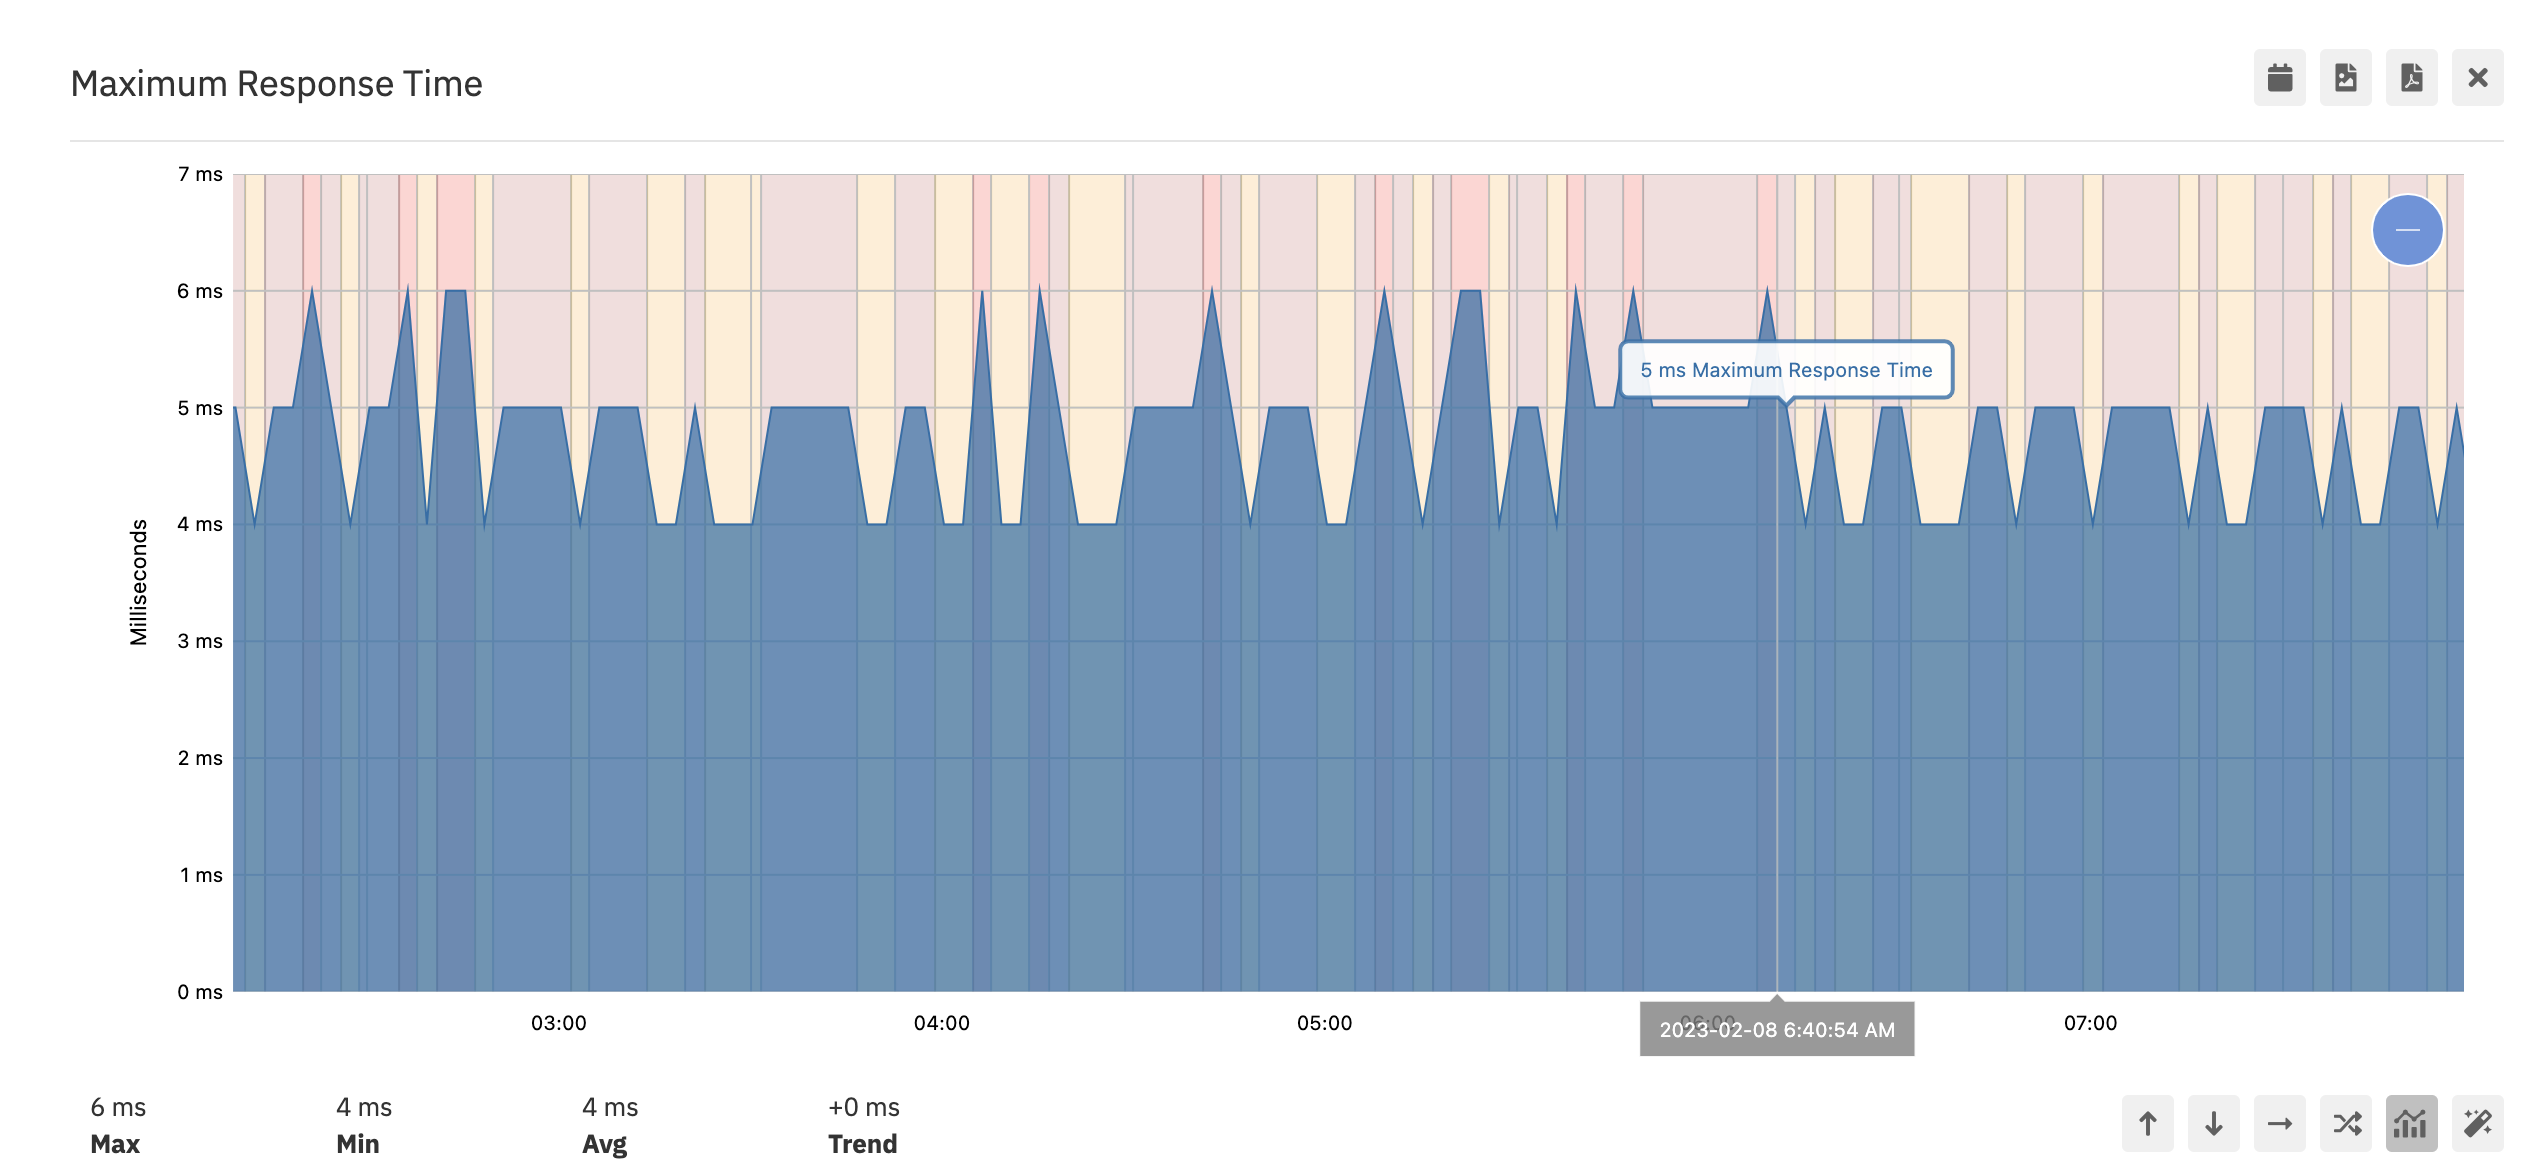
We recently overhauled our graphing features to include a powerful Graph Explorer that lets you pan, zoom, and scroll across graphs of your most important IT monitoring data. Hone in on areas of interest, trends, and time/date ranges like never before with this new feature.
 Graph Explorer
We also added a color-coding system that helps users ascertain at a glance the time that a data point's value has spent in each alert range (Info/Warning/Error/Critical). At any point, you can export the current view of the graph as an image or PDF, making it easy to pop into chats or reports smoothly.
 Graph Explorer
Users who want to learn more can do so by visiting our Graph Explorer blog post or by upgrading your instance to the latest version and giving it a shot yourself. If you aren't yet a FrameFlow customer, you can download a 30-day full featured trial and give the Graph Explorer a try while you're at it!
3. Sector Graphs
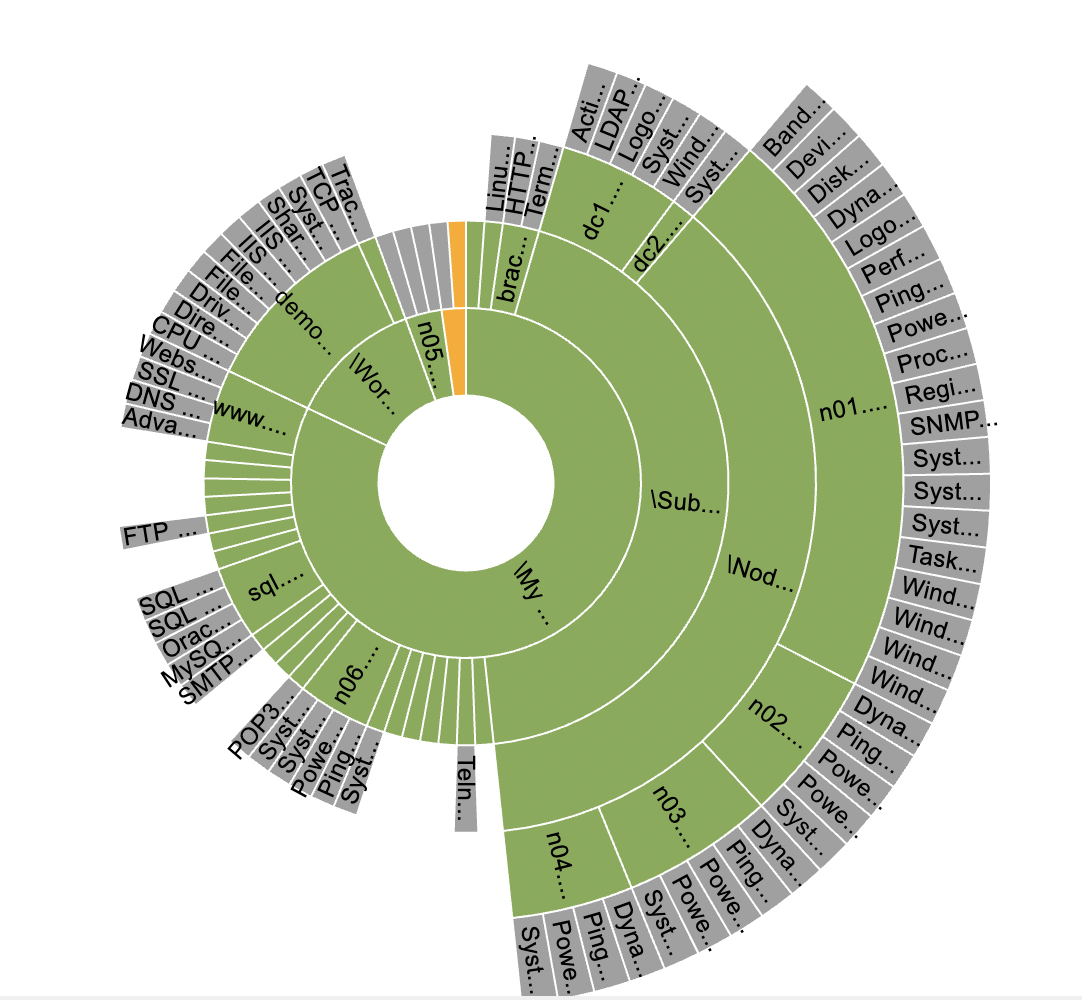
FrameFlow's sector graphs provide a visual of your entire monitoring configuration. They can also be configured to show only certain folders. The center wheel represents network devices in the top level of your organization structure, i.e. the devices in the top folder in the hierarchy. Each subsequent layer represents the rest of the hierarchy of your groups.
 Sample Sector Graph
Each individual segment of the graph is a network device, independently color-coded based on status. An entirely green sector graph represents a monitoring configuration with no active alerts. The nodes at the very outside of the circle are the event monitors that are connected to your network devices. To learn more about FrameFlow's sector graphs, check out our Sector Graphs tutorial.
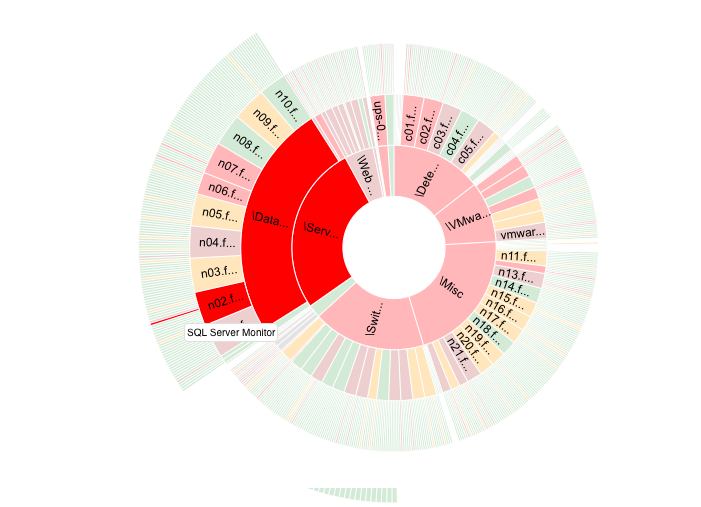 Another Sample Sector Graph
4. Device Drill Down
FrameFlow's device drill down dashboard panel is an interactive top-down view of your event monitors and devices that's perfect for visualizing your IT environment. This monitoring feature is available in the Dashboards section of your FrameFlow installation and lets you click through the hierarchies of your event monitors and network devices. In the below example, you'll see how it can help users with multi-site installations view their IT monitoring environments on a location-by-location basis.
 Device Drill Down in Action
Summary
FrameFlow's powerful visualization tools help you view the structure and status of various parts of your IT environment easily. To learn more about any of the features mentioned in this article, search for them on our Features page to view a setup tutorial for each of them. Keep an eye on our blog for more tips and tricks!
Are you new to FrameFlow? Download now to take it for a spin for free for 30 days and start taking advantage of its enterprise IT monitoring features.