Use Case: Monitoring Latency and Packet Loss
In this article, end users are experiencing delays when accessing websites, both internally and externally. VOIP calls often suffer from stutter or lag. Users report that these issues tend to vary throughout the day. Some systems seem more severely affected than others.
In the following sections of this document, we discuss terminology and concepts related to latency and packet loss and show you how to use FrameFlow to monitor for these issues.
Monitoring Latency
Latency is a measure of network performance that shows how much time it takes for a packet of data to travel from one point to another. Changes in latency can indicate congestion or other issues on the network. Network traffic must pass through multiple switches, routers, and other networking equipment before reaching its goal destination.
To begin fixing this issue, add the relevant network devices to your FrameFlow configuration manually or automatically through device discovery. After that, create a Ping Event Monitor and assign it to the devices you just added. By default, every event monitor runs once per ten-minute interval, but for latency monitoring, you'll want to change that value to once every 15 seconds or so.
 Creating a Ping Event Monitor
Save and run your new Ping Event Monitor for a few minutes. When you come back to it, you'll have plenty of data available to analyze: average and max. response time, ping failures, and jitter.
Ideally, the average response time should closely resemble the maximum response time. This is indicative of good network health. If there's a large discrepancy between these two values or if the average response time changes, it can indicate network congestion or other problems.
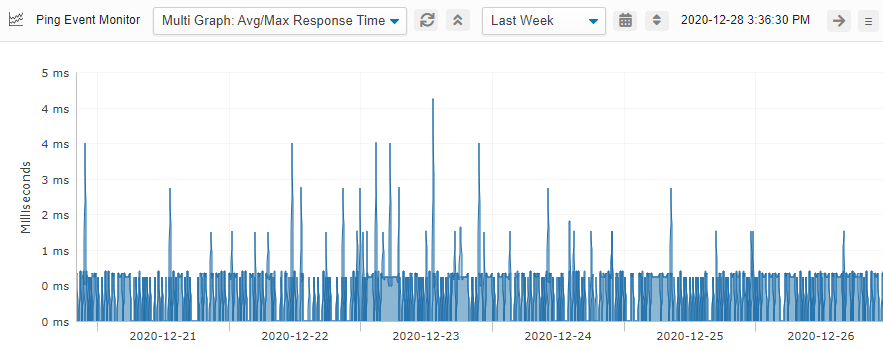 Average/Maximum Response Time Graph
Maximum response time should closely mirror average response time. Large, frequent spikes in max. response time may indicate network instability or other issues.
Understanding Jitter
Jitter is a measure of the variance between response times. Our Ping Event Monitor is configured by default to sample ping response time three times, but you can change that value to whatever number you want. There's a good chance the response time will vary slightly each time the event monitor samples your network devices and the jitter is calculated from that resulting variance. The lower the jitter, the more stable your network.
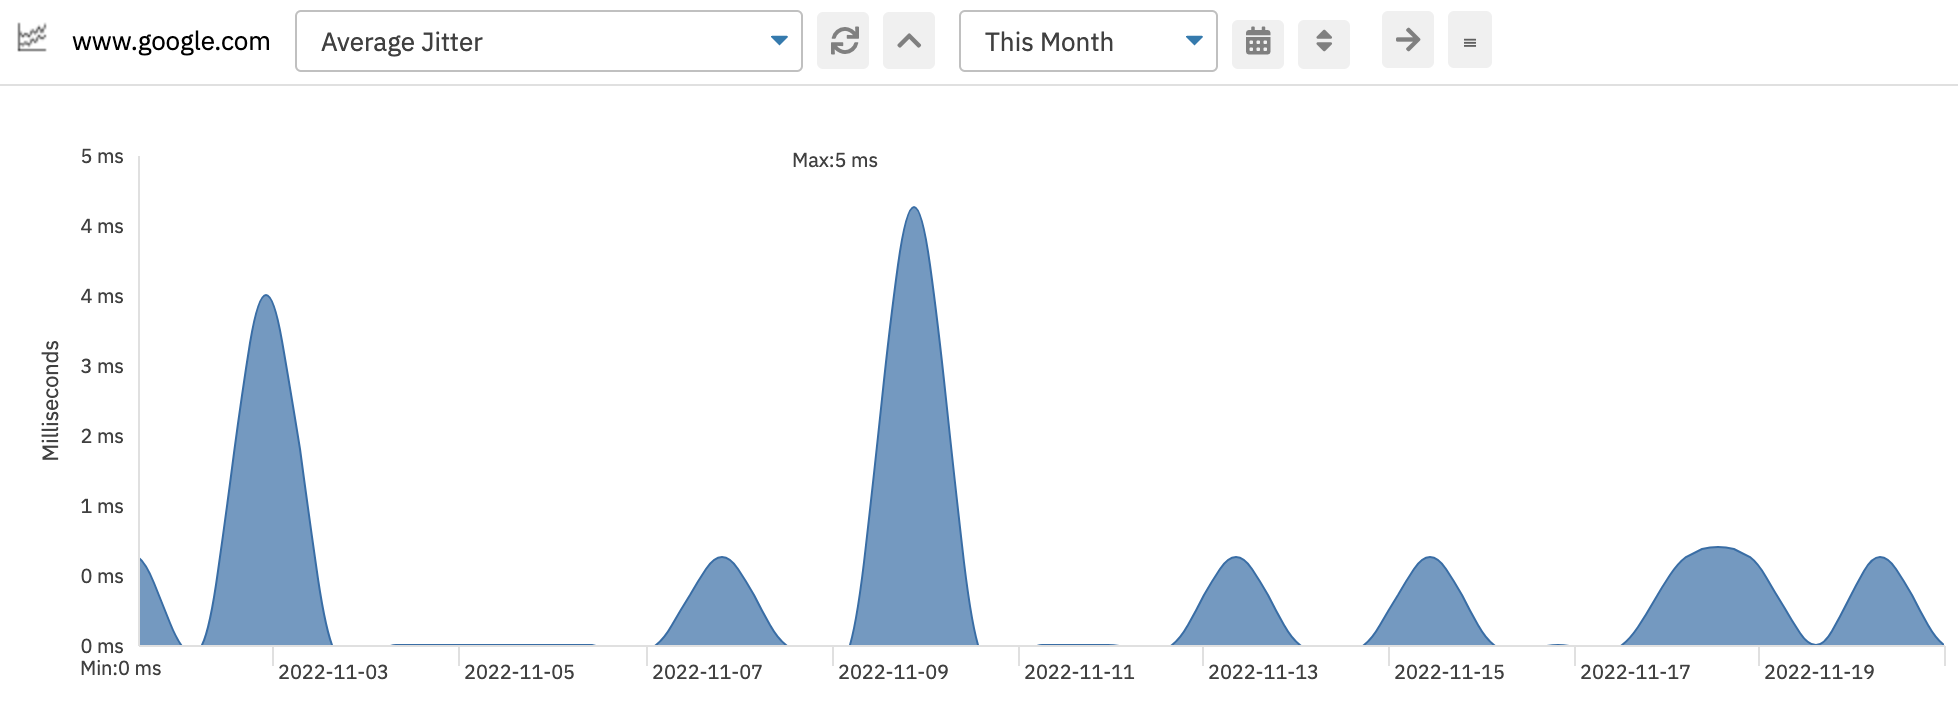 Average Jitter Graph
An example of a stable network link is a point-to-point fiber optic connection. It's likely to have near-zero jitter. An example of an unstable network is a long-distance wireless link.
Latency From Multiple Perspectives
With FrameFlow, you can also measure latency from multiple perspectives. This is most useful for your external-facing properties, like your website or other assets your clients/customers will interact with. Monitoring latency from your headquarters to your website is important, but the results you get from this don't necessarily mirror the experience of the visitors to your website. To monitor the latency of different paths to your website, you can install a remote node in the cloud and monitor externally instead of internally using a Ping Event Monitor as before.
You can even monitor latency from several different locations at once by repeating the remote node installation process in different places in the cloud. This gives the most well-rounded view of the experience different users are having when accessing your site. Note that when measuring latency from multiple remote locations, it is normal for it to be greater from places that are physically or topologically far from where your website is hosted.
Monitoring Packet Loss
A packet loss occurs when a ping check receives no response or fails to receive a response before the timeout. By default, FrameFlow's Ping Event Monitor times out after one second, but you can alter this value in the event monitor's settings. Make sure to keep an eye on any packet loss, especially if all of the ping requests from one event monitor run fail. This could indicate that a network link is down or, more critically, there has been a network equipment failure.
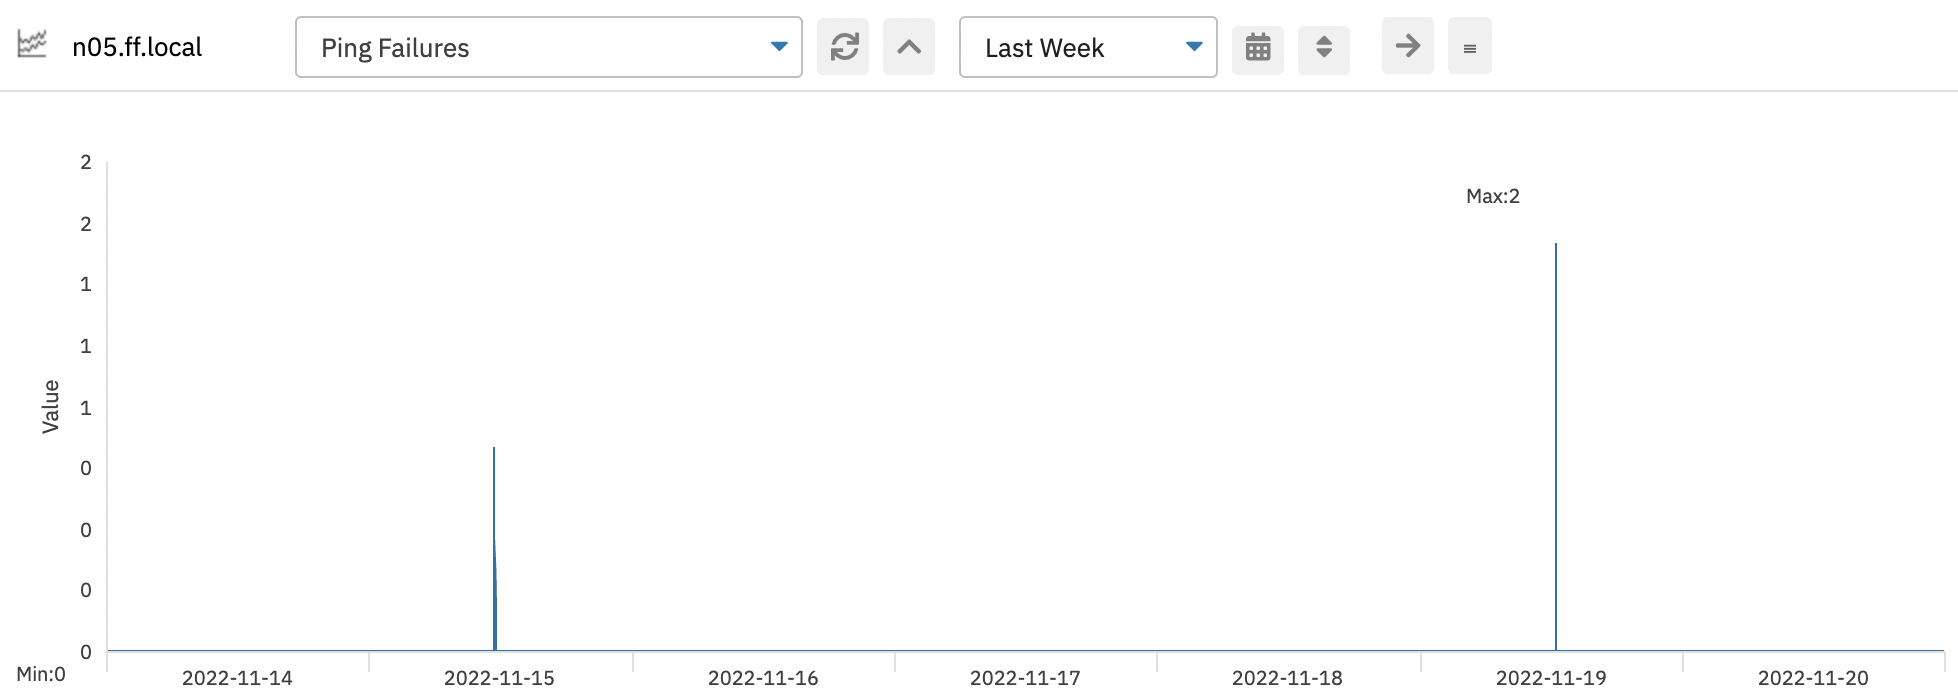 Ping Failures Graph
What about intermittent packet loss? If you have periods where ping requests return results with no problem but also deal with periods of high packet loss, things can be more difficult to interpret. One possible explanation is congestion due to too much traffic on your network. Each switch/router on the path from you to your network has an upper limit on the amount of traffic it can handle. Any incoming requests above the limit risk being discarded at random during times of high traffic.
We recommend that you monitor the losses on your networking equipment with our SNMP Interface Event Monitor, which allows you to monitor the rate of discards for each switch or router and narrow down the networking equipment that's contributing the most to your problems.
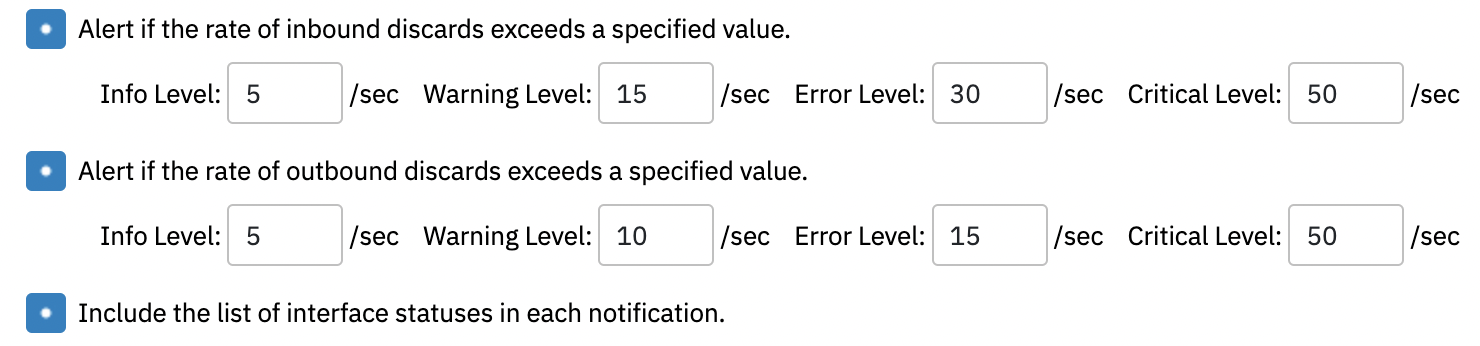 Packet Loss Monitoring Options on SNMP Interface Monitor
Summary
This article taught you how to watch out for latency and packet loss problems with FrameFlow. We hope these use case scenarios have made you excited to begin using FrameFlow to tackle your business's main network concerns.
Are you new to FrameFlow? Download now to take it for a spin for free for 30 days and start taking advantage of its enterprise IT monitoring features.