The SNMP Interface Event Monitor watches the status of your SNMP interfaces by keeping tabs on admin and oper statuses, detecting changes in connections, and monitoring error rates. This monitor will help you stay up to speed on problems that may be slowing down your connections before they cause larger issues. Users who find this tutorial useful may want to check out our SNMP Bandwidth Event Monitor tutorial as well.
In the Event Monitors section of FrameFlow, under the actions tab, select "Add Event Monitor". Select the SNMP Interface Event Monitor. After this, you can specify which network devices you would like to add to this monitor. Under the event monitor settings, you will also need to select your SNMP connection profile. Underneath this, there is a list of monitoring options that will allow you to specify which counters you would like to employ to keep track of various interface statuses. You can select as many or as few from this list as fits your monitoring needs.
 Adding a New Interface Monitor
The option to alert if an interface status changes will send alerts if the admin status or the oper status of any of your devices change. The same alert option exists for interfaces you have marked as favorites, allowing you to distinguish between your most important interfaces and the rest. The option to alert if the total error rate on any interface exceeds a specified value lets you select info, warning, error, and critical thresholds for errors per second experienced by your connection. This way, you can keep tabs on errors before they accumulate into a larger issue.
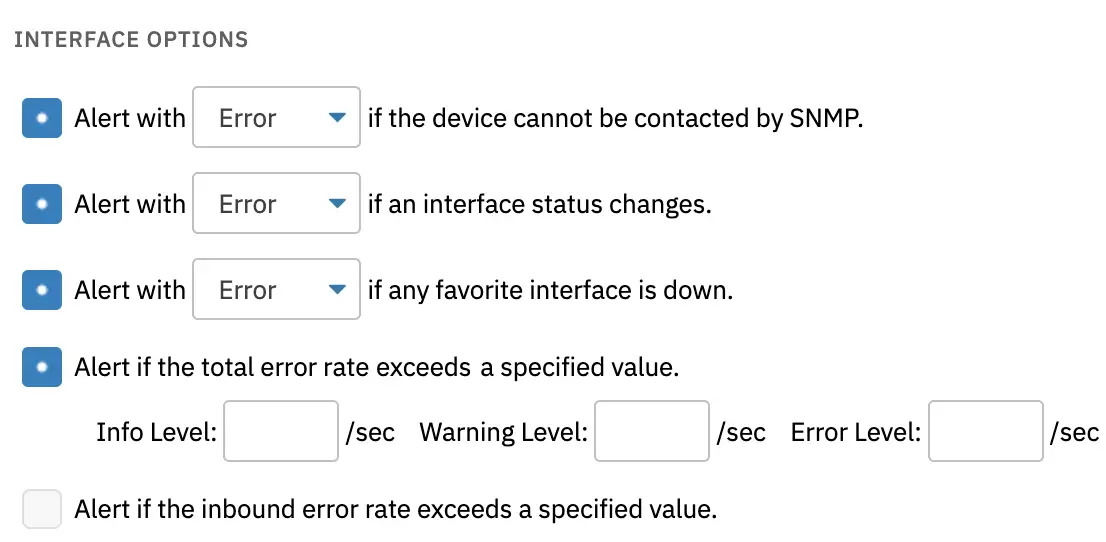 Interface Options
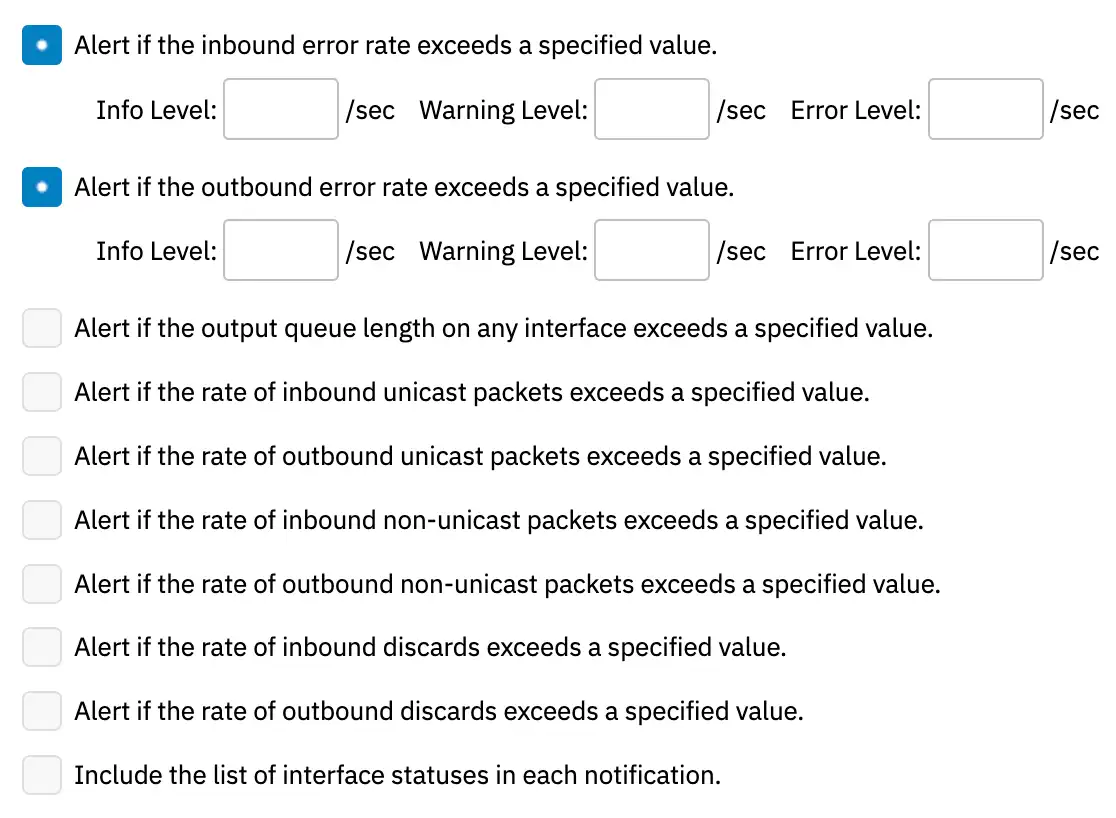 More Monitoring Parameters
The "Descriptions" dropdown menu controls how the names of each interface will show up in alerts. The dropdown menu titled "Data Points" allows you to choose what data is reported in your alerts. With the first option selected, the event monitor will record data points and results for all interface properties, but with the second option selected, the event monitor will only record data points and results for items for which you have specified thresholds. This second option will dramatically reduce the amount of data collected in large monitoring configurations.
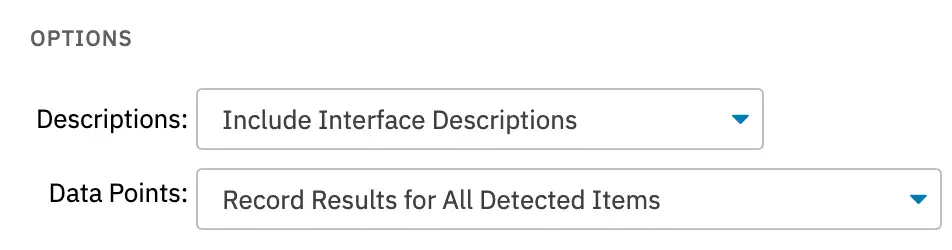 Descriptions and Data Points
The dropdown menu called "Filter" lets you indicate which interfaces you would like to monitor. There is an option to monitor every interface, an option to select which interfaces to monitor, and an option to select which interfaces to exclude from monitoring. With the option to select which interfaces to monitor selected, a text box appears. In this box, enter the indexes of the interfaces you choose to monitor, separated by commas. Use the text box that appears when the option to exclude interfaces is selected in the same way, entering the indexes of the interfaces you would like to ignore. Additional tips, accessed by clicking the question mark icon in the event monitor settings, are pictured below.
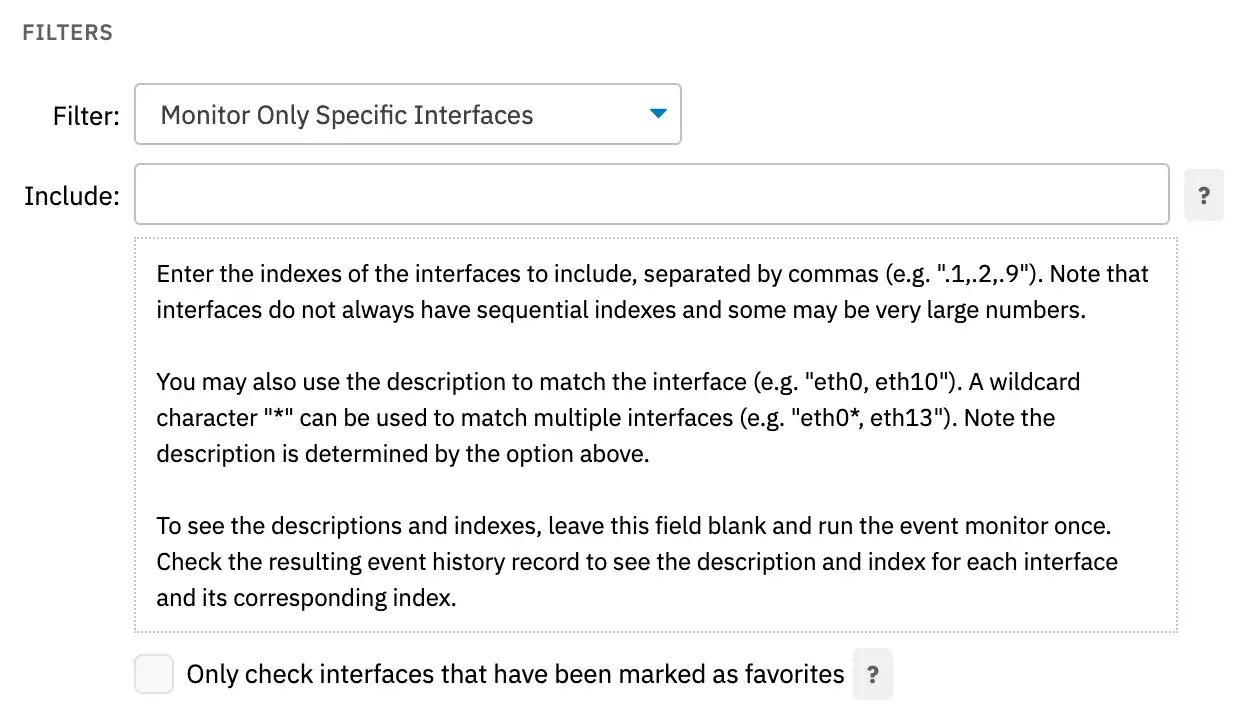 Interface Filtering Options
In this tutorial, we taught you how to set up an SNMP Interface Event Monitor to begin monitoring your interfaces. We explained a sample of the monitoring options available and how to tailor the monitor to your needs by choosing data points, interface descriptions, alert thresholds, and filtering parameters. Refer to our SNMP Interface Event Monitor reference guide for more documentation on this event monitor. Stay tuned for more tutorials on related subjects coming soon!
More IT Monitoring Features