Unified Monitoring: Not Just a Buzzword
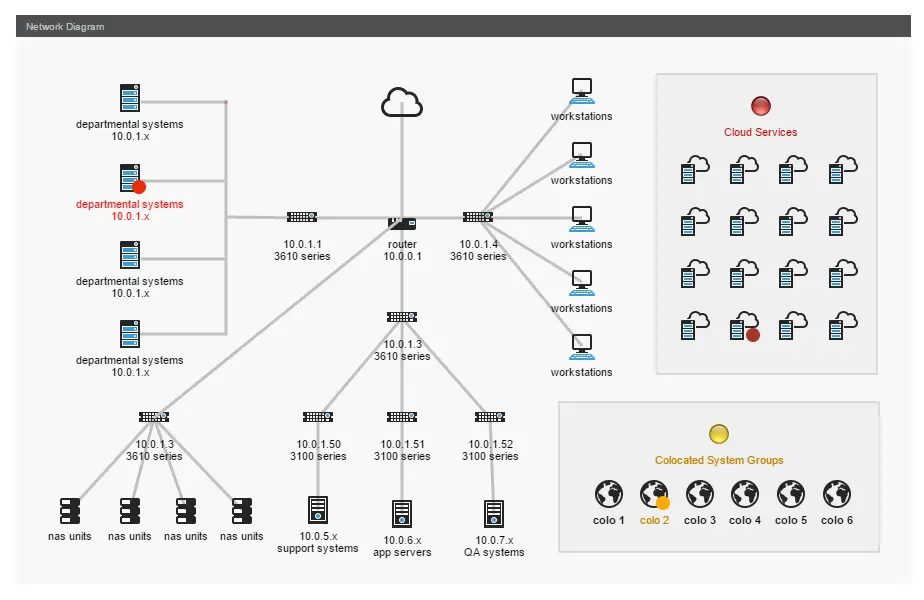
Monitor your Servers, Networking Equipment, Cloud Services, and much more.
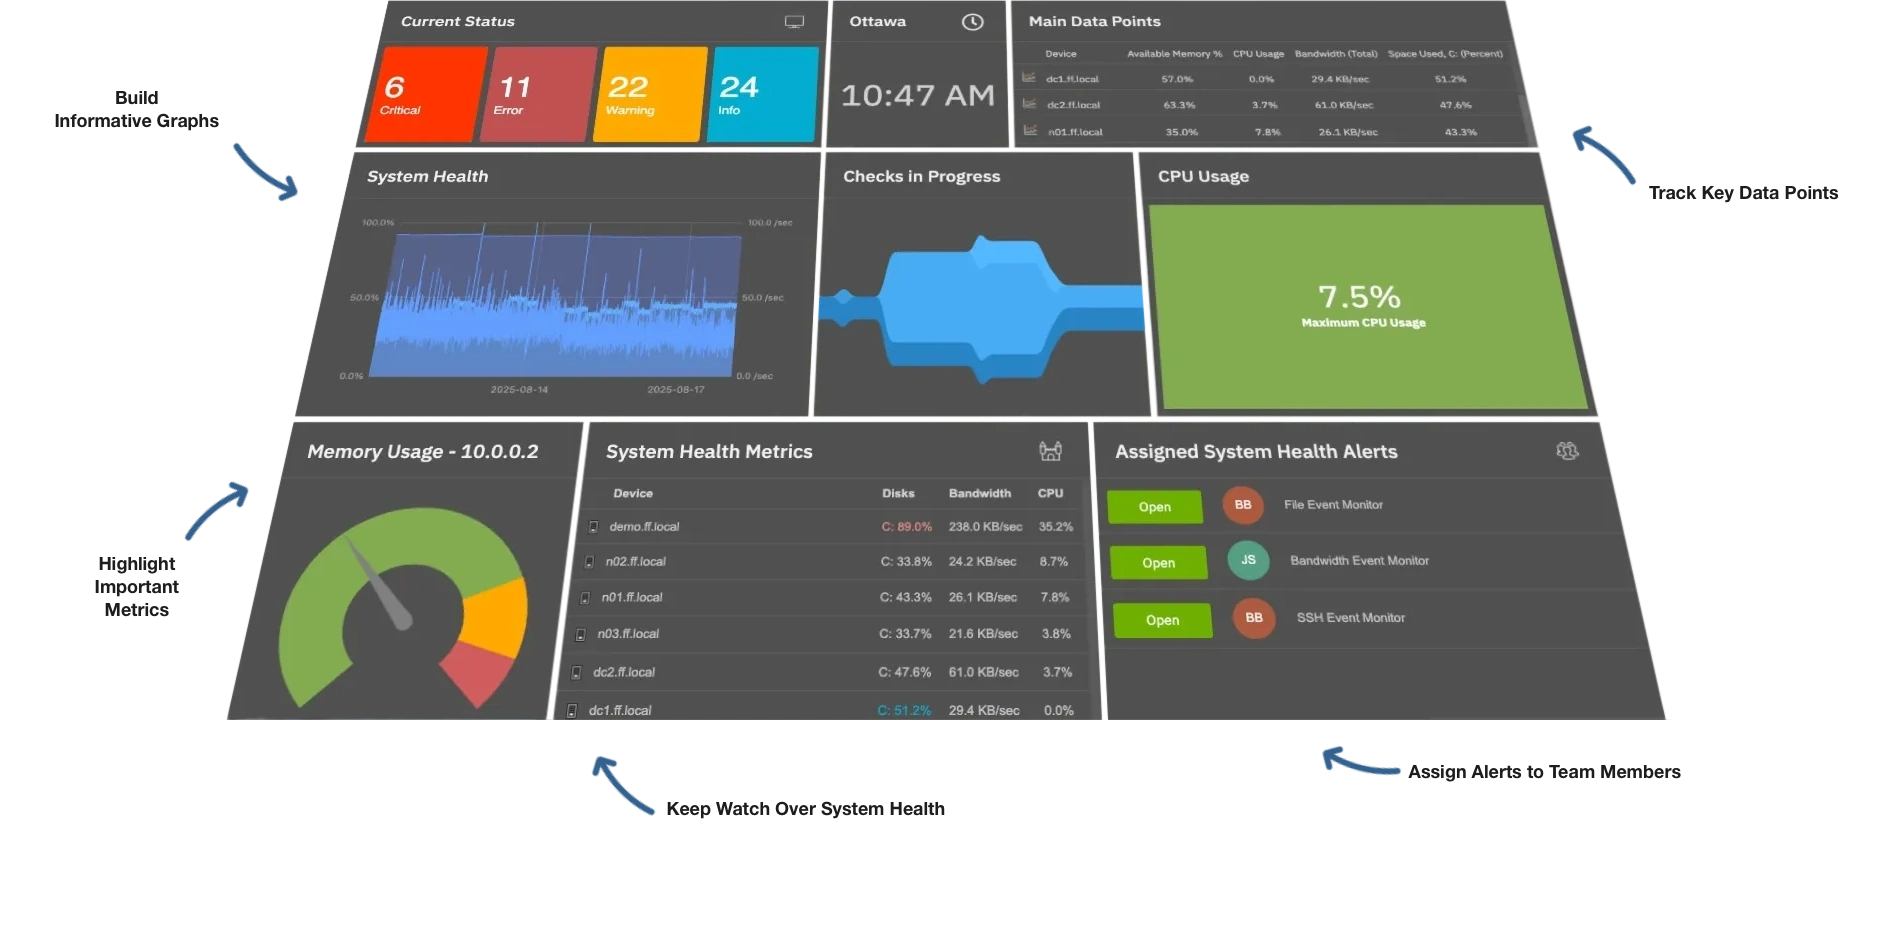
Get Alerts About Issues Before They Become Big Problems.
Get Alerts About Issues Before They Become Big Problems.
Windows Monitoring
Linux Monitoring
SNMP Bandwidth
VMware Snapshots
Azure Billing
Entra ID Logins
HP iLO
Microsoft Intune
Disk Usage
CPU and Memory Usage
SSL Certificates
Active Directory
Event Logs
Windows Services
PowerShell Scripting