Mastering SNMP Monitoring with FrameFlow: A Step-by-Step Guide
Simple Network Management Protocol (SNMP), despite its name, can be daunting to approach. With different SNMP versions and hundreds of OIDs (object identifiers) to manage, it's easy to get lost when it comes to SNMP monitoring. Luckily, FrameFlow can hide the complexity of SNMP if needed, allowing you to focus on a single metric like SNMP bandwidth or interface status. On the other hand, our general SNMP Event Monitor has more advanced settings that you can use to monitor niche conditions.
If you need an IT monitoring solution with strong support for SNMP, look no further. From our eight dedicated SNMP monitors that cover metrics like bandwidth and uptime to our built-in SNMP discovery tool, FrameFlow has what you need to stay updated on the statuses of your SNMP devices 24x7. In this article, we'll explore some of these features and their benefits.
SNMP Bandwidth Monitoring with FrameFlow
Our popular SNMP Bandwidth Event Monitor automatically finds all interfaces on each connected device and starts to monitor incoming, outgoing, and total bandwidth for them around the clock. All you need to know to get started is the SNMP community string and port number or your SNMPv3 connection values. Since FrameFlow hides all the complicated parts of SNMP with this event monitor, even beginners can take advantage of its features. You can measure the rates for each interface on all of your devices, either as a percentage or as a rate per second.
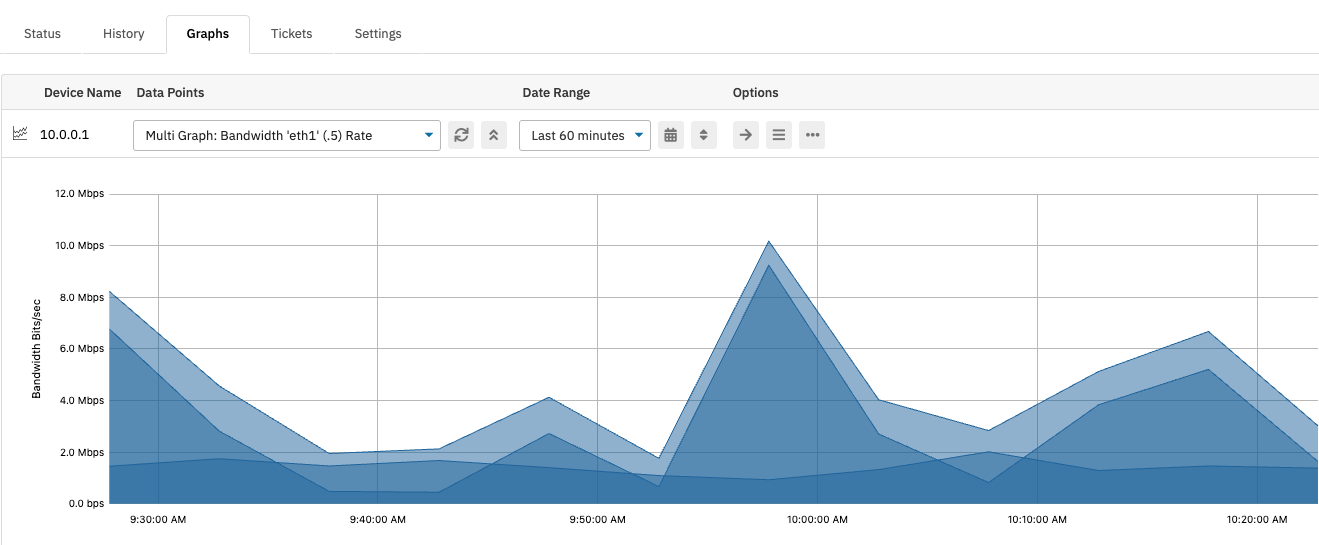 SNMP Bandwidth Graph
Tracking and Alerting on SNMP Uptime
Another important metric for your SNMP devices is uptime. Disruptions in uptime can indicate outages, reboots, and failures that FrameFlow will alert you about on a chosen interval. Additionally, you can receive alerts if connected devices have not been rebooted in a given number of days, which can help you identify reboots that should have occurred but did not. This can help keep your devices running optimally.
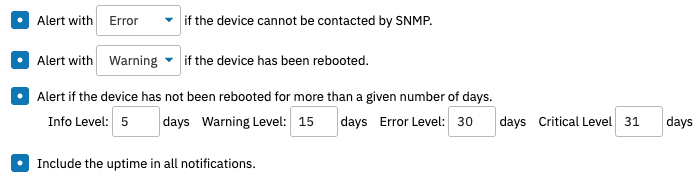 SNMP Uptime Settings
Viewing and Monitoring SNMP Interface Metrics
Our SNMP Interface Event Monitor unlocks interface data for each connected SNMP-enabled device. Each device gets a new tab on its page that lists all interfaces and lets you interact with them directly from the Network Devices section. You can mark interfaces as favorite, view status graphs, admin and operational statuses, and more.
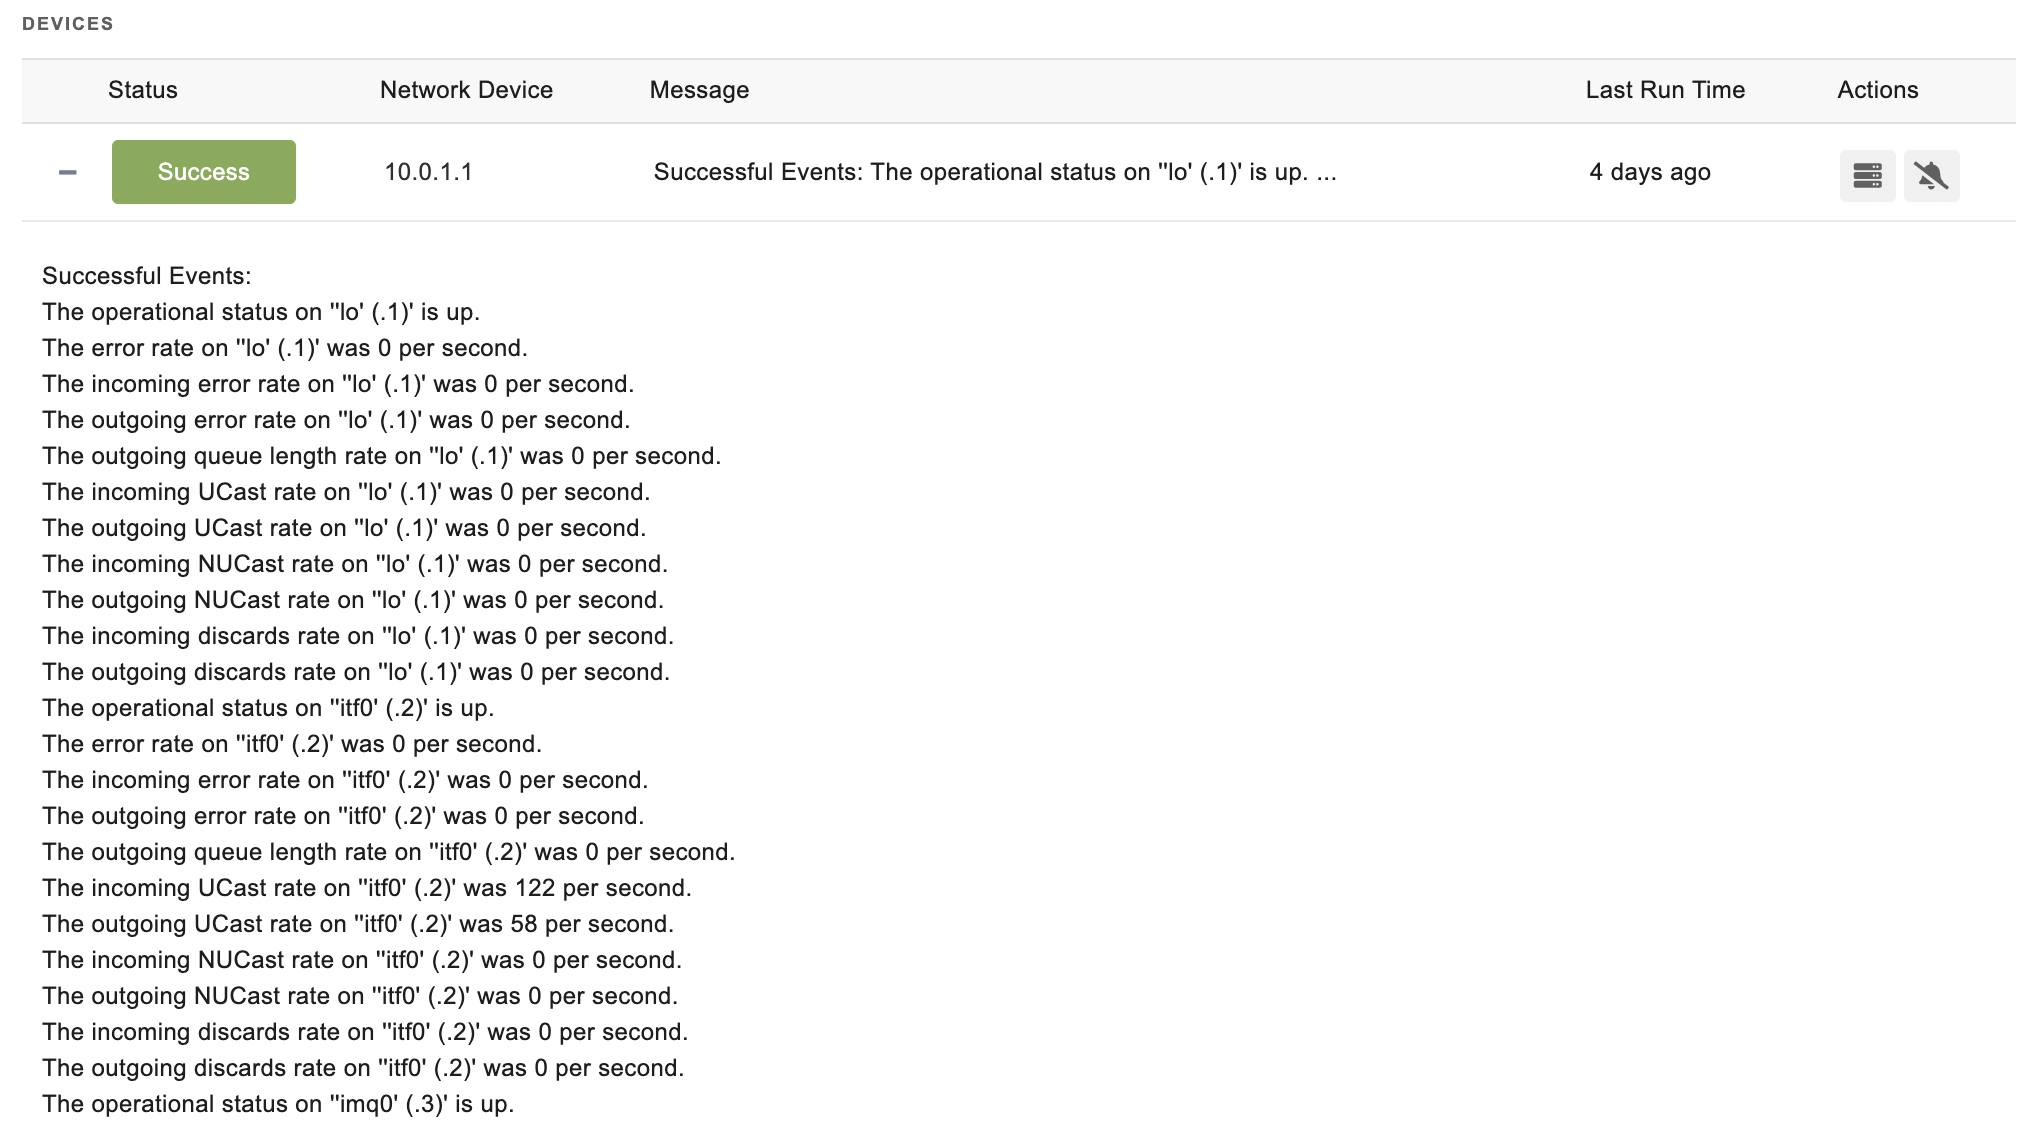 SNMP Interface Output Example
The SNMP Interface Event Monitor also has alerting options that can help you keep tabs on several important metrics for all your SNMP interfaces. You can receive an alert of your choice of severity if any interface's status changes or if any interface marked as "favorite" is down. The event monitor also lets you set alerting thresholds for inbound, outbound, and total error rates, packets, and discards per second. You can choose to be alerted about the outbound queue length as well, allowing you to get notified if the number of outbound packets waiting to be transmitted exceeds the limit you specify. These options help you single out interfaces with poor performance so you can take steps to improve them.
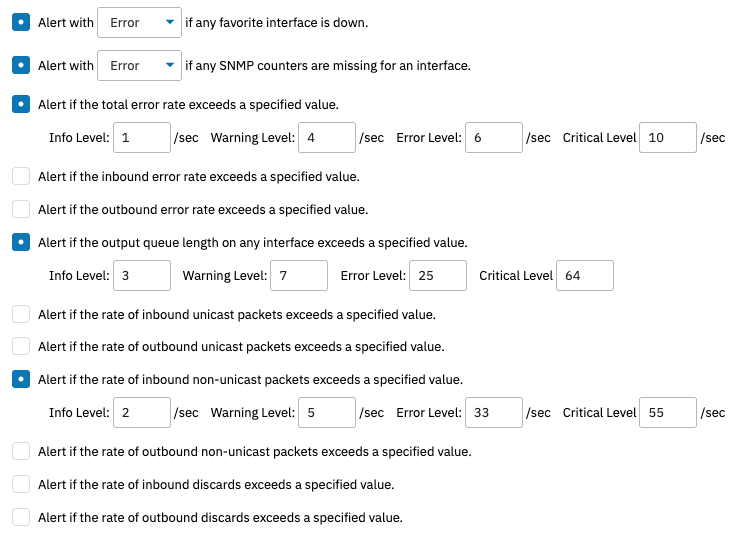 SNMP Interface Monitor Settings
Advanced SNMP Extensibility with the SNMP Event Monitor
For more advanced SNMP monitoring, we created a generic SNMP Event Monitor that lets you input the OID or symbolic name for the metrics you want to monitor. Then, you can use the "Comparison" dropdown to create custom alerting parameters. Let's consider some examples below.
Many of our users have an SNMP-enabled device with an inlet or ambient temperature sensor that's very important to keep close tabs on. Using the SNMP Event Monitor, you can receive an alert if the temperature exceeds acceptable thresholds. This is crucial because an increase in temperature can indicate problems, such as an outage with your cooling/HVAC systems. Getting alerted early can help mitigate performance issues and identify patterns that you can then take action to correct.
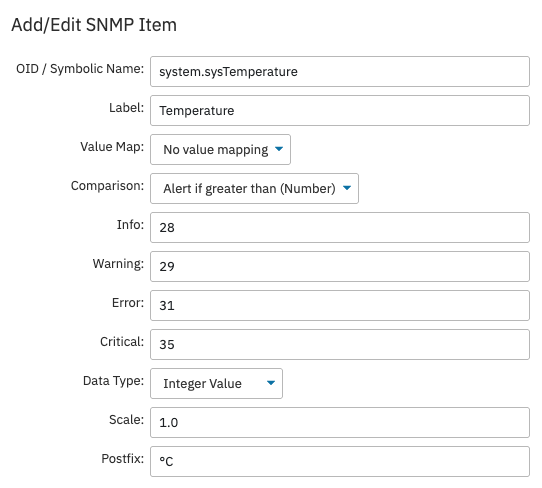 SNMP Monitor Configured for Measuring Temperature
The SNMP Event Monitor also lets you input multiple SNMP items to monitor at once. You can configure the event monitor to output a table with all these values included for each connected network device each time the event monitor runs. You can compare the values in these tables against each other and themselves between event monitor runs to single out values of concern over time.
Oftentimes, our users have an SNMP-enabled device that they want to monitor but don't know how or where to start. For example, imagine that you want to monitor an inverter with FrameFlow's SNMP Event Monitor to keep track of its voltage over time. To do so, you'll need to find the specific OID that represents the voltage for your device.
Discover OIDs with FrameFlow's Built-In SNMP Browser
This is where FrameFlow's integrated SNMP browser comes in. It's located in FrameFlow's Tools section and helps users find all supported values for any SNMP-enabled network device. To find the OID for your inverter's voltage, just enter the device's name or IP, select an SNMP profile, and run the scan. The scan will output all supported values for the device. From there, you can select the values of interest and automatically populate a new SNMP Event Monitor with those values.
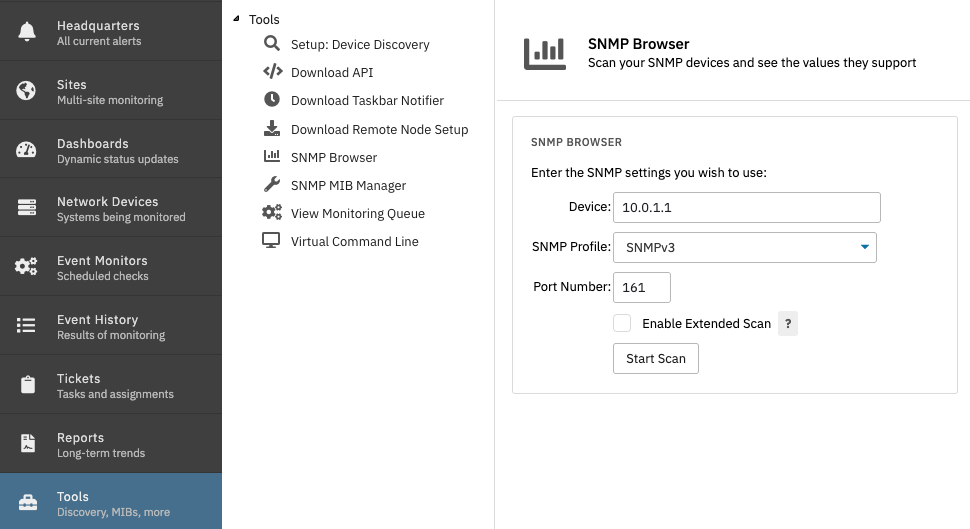 Setting Up SNMP Browser for Scan
Managing and Converting MIB Files with FrameFlow
FrameFlow's SNMP tools can monitor any SNMP-enabled device, no matter how niche. Imagine that you have an SNMP-enabled coffee maker at one of your locations that you want to monitor. As long as there are OIDs for these values, you could measure the coffee output per day or the brew temperature of the device. When viewing the results of the SNMP browser's scan, you might encounter numeric OIDs that don't automatically come with friendly names. There could be dozens of these depending on how many values your device supports, so it's important to understand what they all mean. You’ll need the MIB files (management information base files) to translate these numeric OIDs into readable values.
To get these values, we recommend downloading the MIB file from the manufacturer and adding it to the SNMP MIB Manager that FrameFlow provides, also in the Tools section. Once you upload a MIB file here, you can run a test to check that the upload was successful. Sometimes one MIB file depends upon another, so errors might arise if you don't include both files. Once your test comes back successful, you can head back to our integrated SNMP browser and run the scan again. If done correctly, the numeric OIDs you found in the first scan will now have friendly names.
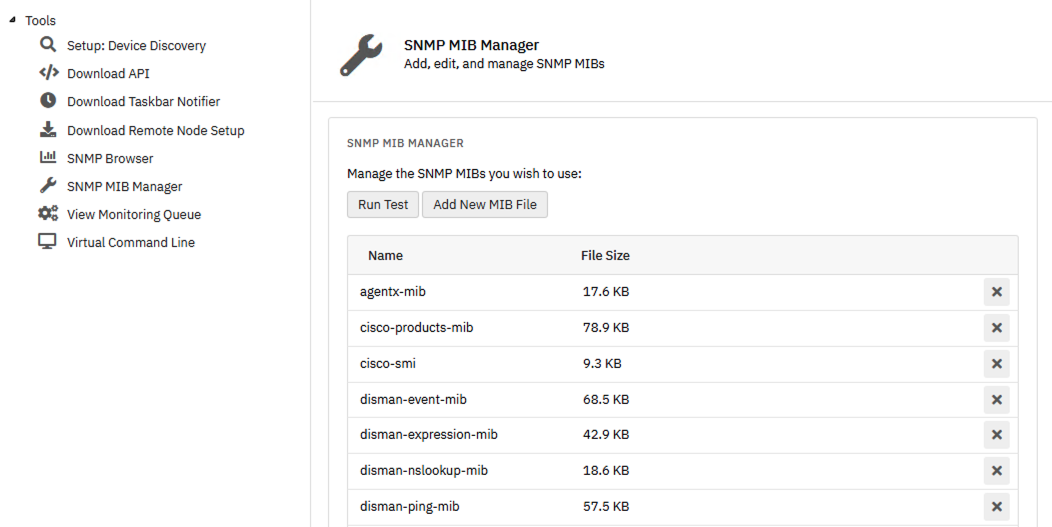 MIB Manager
SNMP and Beyond: Discover More About FrameFlow
Now that you know about some of our key SNMP monitoring features, it's time to get to know FrameFlow for yourself. If you're new to FrameFlow, download the free trial now to take it for a spin for free for 30 days and start exploring our SNMP monitoring features and much more. We offer a fully-featured 30-day trial so you can take advantage of all of our monitoring tools during your trial period.