Use Case: Monitoring Log Files
Log files are used by many different applications to record activities, usage patterns, and operations over time. As such, they're rich with information you may want to monitor. This use case takes you through a scenario in which you have daily backups to a log file and want to monitor that file for error messages or other issues. We'll also cover more complex log file monitoring using regular expressions. Read on to see how we'll handle this scenario.
The event monitor we'll be using can be used to monitor any kind of Windows file. We showcase the options applicable to our log file use case here but check out the File Event Monitor's Technical Resources page to see all its options and capabilities. To monitor files in a non-windows environment, FrameFlow provides a similar event monitor for Linux. The Linux File Event Monitor also has the option to check the contents of your file, but you can't use tokens in the path to the file like you can with Windows.
Monitoring Log Files
To begin monitoring log files with FrameFlow, you'll need to create a File Event Monitor and assign it to the network devices that contain the log files you want to monitor. Then, you'll need to add the full UNC path to the log file, as shown below. Instead of the device name, use [devicename] which will be replaced by the selected device name(s) when the event monitor runs. Because of this, you can add multiple network devices as long as the path to the log file is the same.
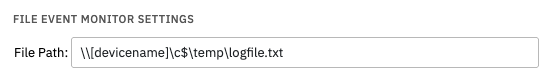 UNC Path Field
The File Event Monitor has tons of useful options, but for our purposes, we'll scroll down and enable the option to check the contents of the file. This will unveil some new options, the first of which will alert you if the file contains the text you specify. This is the one we'll be using today. In the text box provided, enter "Error", "Backup Failure", or whatever language is used in error messages for the log you are monitoring. You can then choose to include information like what line the text was found on and the lines that come before and after it. This helps contextualize your potential error message.
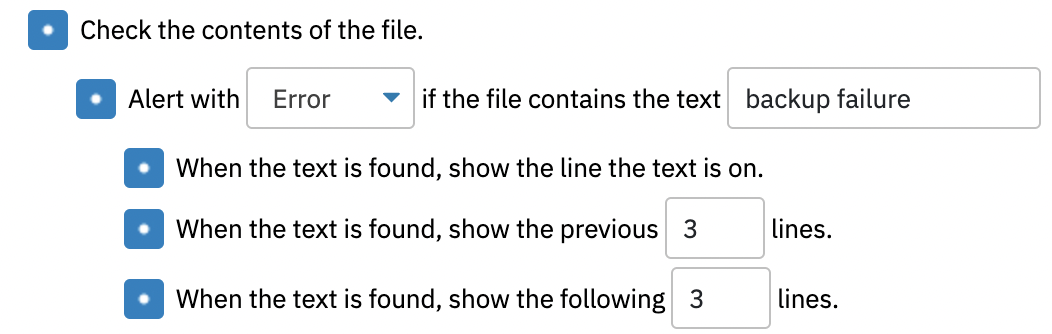 Checking Log File for Specific Text
If you're only looking to be alerted about specific types of error messages, you can use the option "Do Not Alert if the Same Line Contains" to add a stipulation to the option you configured above. This means that you'll only receive alerts about the error messages that contain the text you specify and do not contain the disqualifying text from the option shown below.
 "Do Not Alert if the Same Line Contains" Option
Since log files usually append new text to the existing log when they update, we also provide an option that lets the event monitor skip over the text in the file that it's already checked. That way, the event monitor returns results faster because it doesn't have to parse through text it's already checked to get to the new stuff at the bottom. Along with this option, you can choose to receive an alert if the event monitor finds the log file to be shorter than the last time it scanned it.
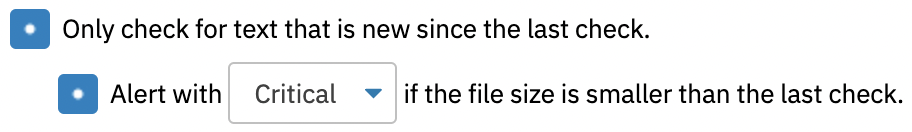 Option to Skip Text Already Checked
At the bottom of the event monitor's settings, you'll find an option called "Enable Date/Time Tokens in the File Name". With this option selected, you can use tokens like %%YYYY%% in the file name specification and they will be automatically replaced with the values corresponding to the date and time at which the event monitor ran. Since most log files record the date in some way, we've added date and time tokens that work as placeholders for the actual date in the file path. Click the question mark next to the "Enable Date/Time Tokens" option for a link to the full list of available tokens.
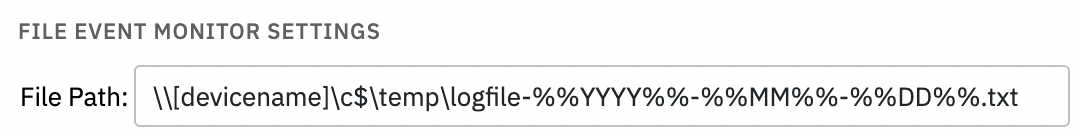 Tokens to be Replaced by Date When Event Monitor Runs
Scheduling
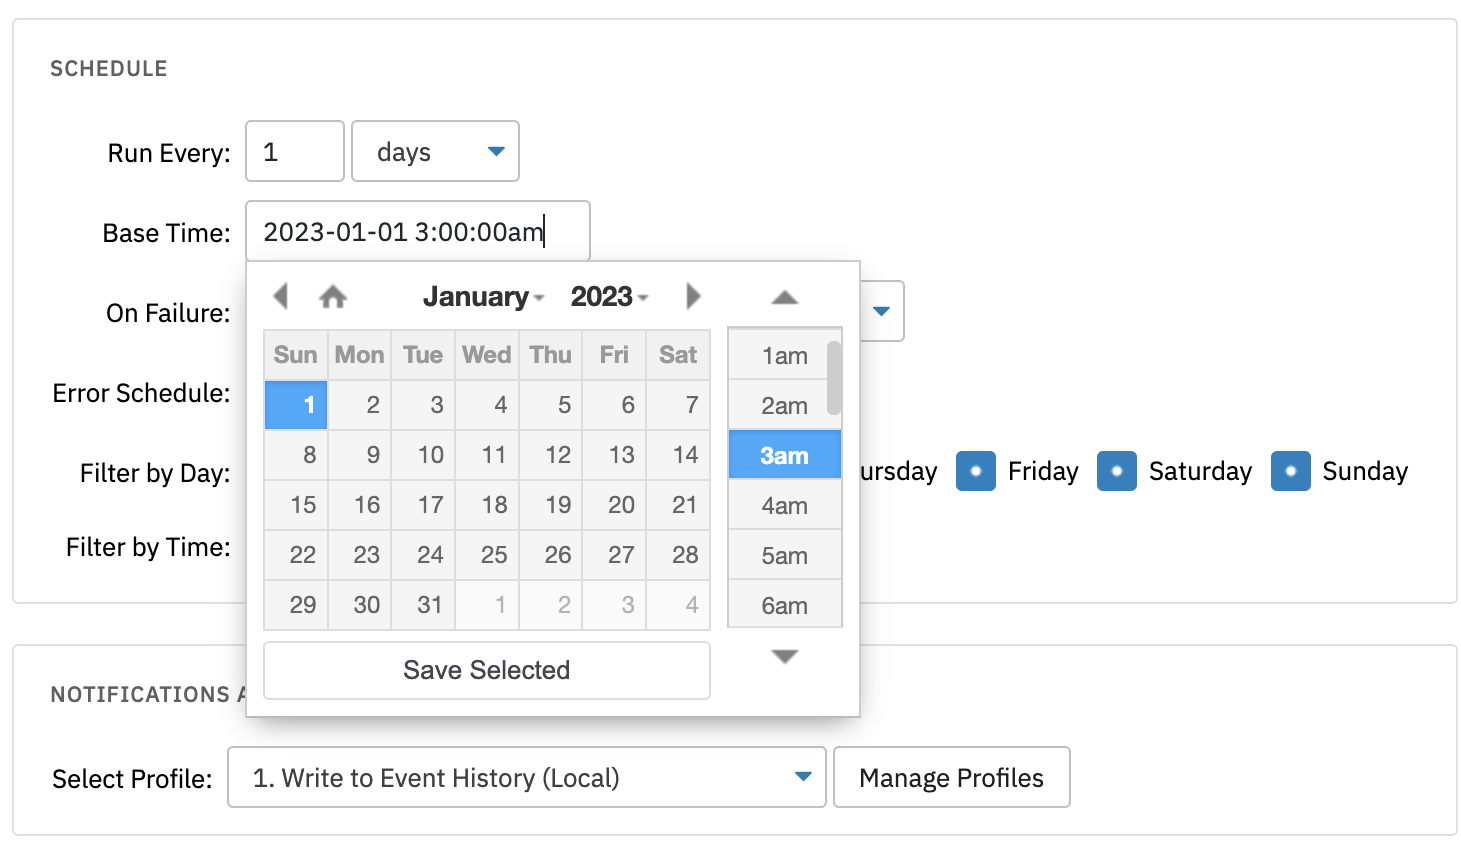
Next up, scroll down to the "Schedule" section of the event monitor. Since most log files update once per day at a certain time, you can modify the default values here to match the schedule that your log file follows. Sometimes your log file is set to update at a certain time each day, but it takes time for that update to actually be appended to the log file. For this reason, it's important to schedule your event monitor's base time to be shortly after the scheduled update time for the log file. You can use the other scheduling settings to help the event monitor fit your specific monitoring conditions as well.
In the below example, our log file updates at 2:00 AM but we left it an hour worth of buffer time to complete its nightly update.
 Scheduling Section
Highly Specific Log Monitoring Needs
For users who have more complex log file monitoring requirements, we added the option to use a regular expression when matching text. This can help you parse through the text of your log file with more specificity.
 Regular Expression Option
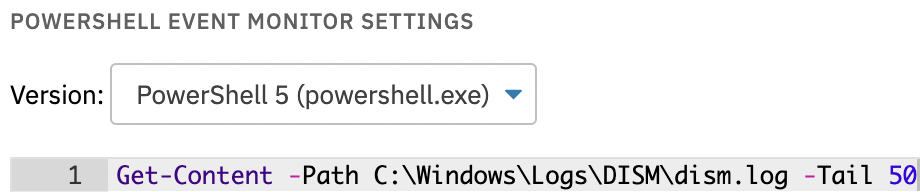
If you still can't find what you're looking for, our PowerShell Event Monitor can help. Using "Get-Content", you can parse out specific sections of your log file for easy analysis, like grabbing the very end of your log file to see what's new for that day. Once you've honed in on the lines that are important to your monitoring, you can use PowerShell to perform almost limitless actions on them. Create your own alerting parameters, data points, and custom alert messages: anything is possible with PowerShell monitoring.
 PowerShell Command for Last 50 Lines
Summary
In this article, we showed you how to monitor log files with increasing granularity with FrameFlow. We showed you how to check any Windows-based file, how to use tokens in the file path, and how to set up custom alerting parameters for your log files. Stay tuned for more blog posts highlighting FrameFlow use cases and features!
Are you new to FrameFlow? Download now to take it for a spin for free for 30 days and start taking advantage of its enterprise IT monitoring features.