The Amazon AWS DynamoDB Event Monitor watches DynamoDB metrics for all your AWS devices. It can check any Amazon AWS DynamoDB table and run PartiQL statements. It shows the results retrieved and alerts based on values found in the results.
To begin, set an alert level to receive if the event monitor cannot connect to AWS. Note that this event monitor queries AWS DynamoDB. AWS charges your account based on the number of queries you run.
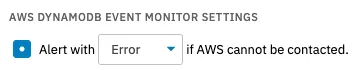 Connection Settings
The option to receive an alert if any table is greater than a certain size lets you specify table sizes that will trigger each level of alert. You can also monitor specific tables in the same way.
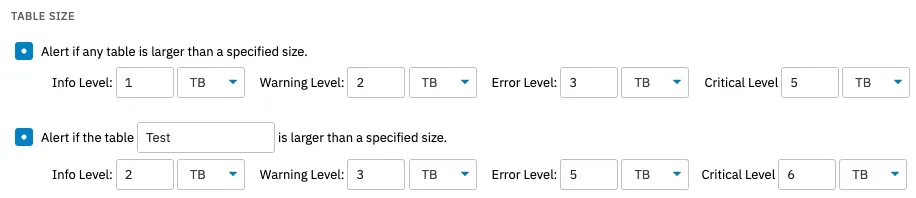 Table Size Options
Check the first box to receive alerts if any table has consumed read capacity over a threshold capacity you specify. The next option does the same thing but lets you specify a table to watch over in specific.
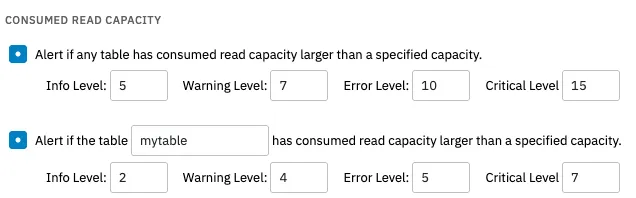 Consumed Read Capacity Options
You can also choose to receive an alert if the total consumed read capacity across all tables is larger than a specified capacity. Enter the levels of consumed read capacity that will trigger each level of alert.
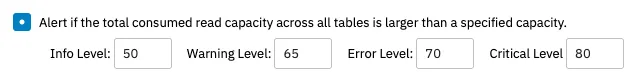 More Consumed Read Capacity Options
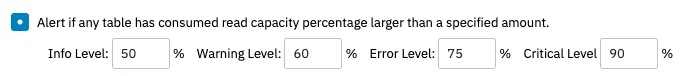
Check the fourth box to receive an alert if the consumed read capacity percentage for any table exceeds the values you specify.
 Consumed Read Capacity Percentage Option
The final option lets you specify a table and will alert you if the consumed read capacity exceeds a percentage that you specify.
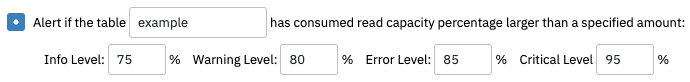 Table-Specific Consumed Read Capacity Option
The next few options cover consumed write capacity. You can choose to receive an alert if any table has consumed write capacity over the amount you specify. There's another option below that alerts in the same way, but about a specific table.
 Consumed Write Capacity Options
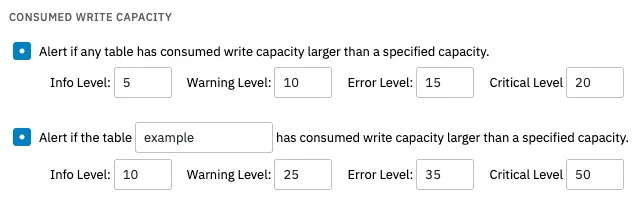
Next, choose the amount of consumed write capacity across all tables that will trigger each alert level. After you've configured this option, set alerts for the write capacity percentage. We provide alerting options for any of your tables or for one specific table as with read capacity above.
 More Consumed Write Capacity Options
Just as with consumed capacity, you can choose to receive alerts if any table's provisioned read capacity exceeds a specified amount. Below this, there's an option to do the same thing but with the focus on one specific table.
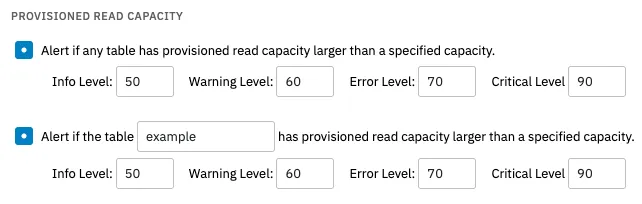 Provisioned Read Capacity Options
You can also choose to receive an alert if the total provisioned read capacity across all tables is larger than a specified amount.
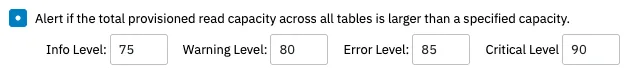 Provisioned Read Capacity Option for all Tables
The first and second options will send an alert if more than the specified amount of provisioned write capacity is detected. The first option covers all tables and the second lets you monitor a specific table. The final option will alert if the total provisioned write capacity across all tables exceeds the capacity you specify.
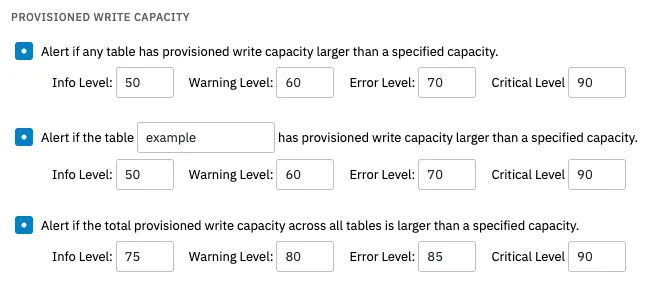 Provisioned Write Capacity Options
Under "Backups", you can access some additional settings that control the way your data will be backed up. You can choose to be alerted if any table hasn't been backed up in a certain amount of days. Underneath that, the same option exists but for a specific table instead of all of them.
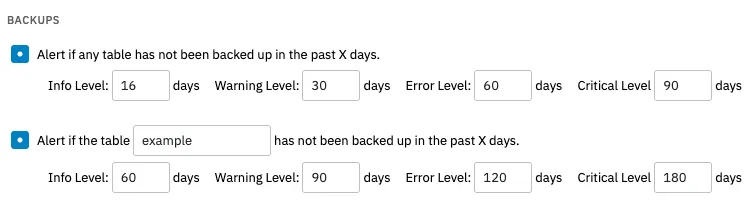 Backup Options
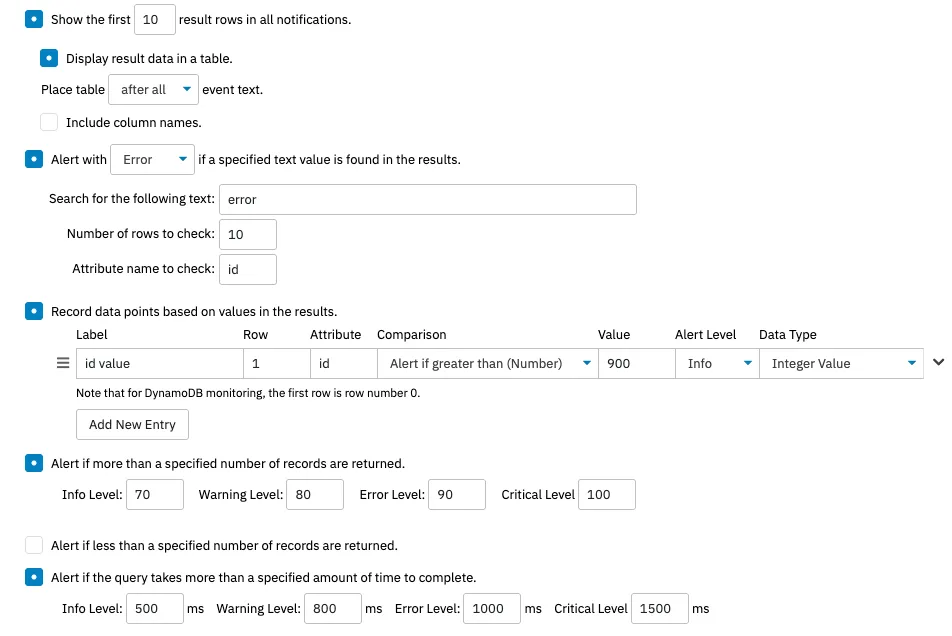
The Amazon AWS DynamoDB's final option is to run a PartiQL command. Enter your command in the text box provided, then configure the below settings.
 PartiQL Options
You can choose the number of result rows that you want to display in the event text, search the results of the command for specific text strings, record data points, receive alerts if more than a specified amount of records are returned, and monitor the query based on the amount of time needed to reach completion.
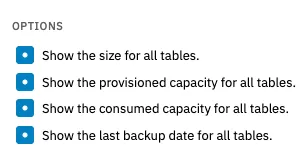
The event text is the summary generated by an event monitor each time it runs. You can choose what information you want to include each time your DynamoDB Event Monitor runs.
 Event Text Options
Choose whether or not you want to include the size, provisioned capacity, consumed capacity, and/or last backup date for your tables in the text generated each time the event monitor runs. Once you complete this step, your DynamoDB Event Monitor is ready to go!
In this tutorial, we showed you how to set up an Amazon AWS DynamoDB Event Monitor and begin monitoring your databases. Keep an eye on the Features page of FrameFlow's website as we're adding new tutorials often. Refer to our Amazon AWS DynamoDB Event Monitor reference guide for more documentation on this event monitor.
More IT Monitoring Features