The Calculation Event Monitor collects graph data points and makes calculations based on them. This allows you to make generalizations about the data gathered by your other event monitors at a glance. In this tutorial, we'll show you how to use this event monitor to gather intel on how your network is flowing.
To begin, select the data points that the calculations will be based upon. Use the data point chooser to select the network device you want to use, then select some data points available to that device.
 Adding Data Points
To keep track of each data point later, give each of them a label as well.
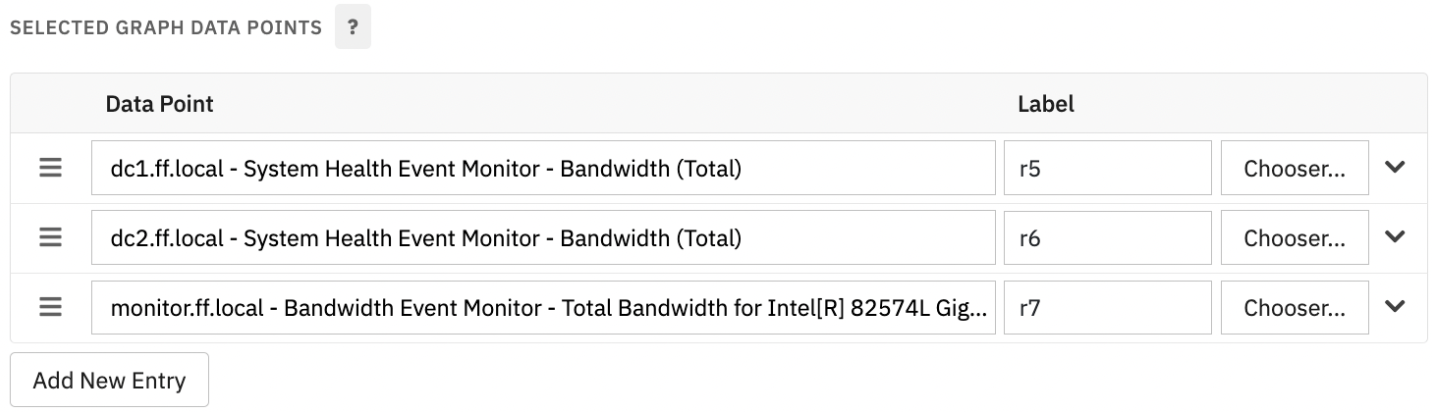 Data Points with Labels
Once you've finished adding data points, it's time to create an equation. Suppose you want to know the average rate of bandwidth for a network device. Add in a few data points from the total rate of the device, then in the textbox labeled "equation", enter a mean calculation using the labels for each data point as the variables. The end result would look like this, where r5, r6, and r7 are the labels for each data point:
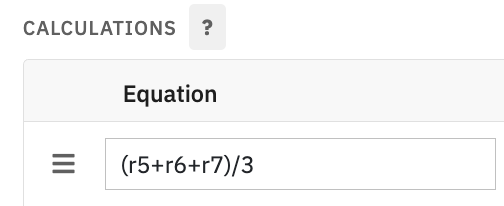 Equation Example
In this example, you would label the equation "average". This label will let you know what calculation was carried out to produce the numbers that you get. As you can see, the possibilities with the Calculation Event Monitor are numerous. With the "Comparison" and "Value" fields, you can set alert conditions. The entire list of comparisons can be found below. With the exception of the "Record/Calculate Value" options, the comparison depends on the value you input in the "Value" field.
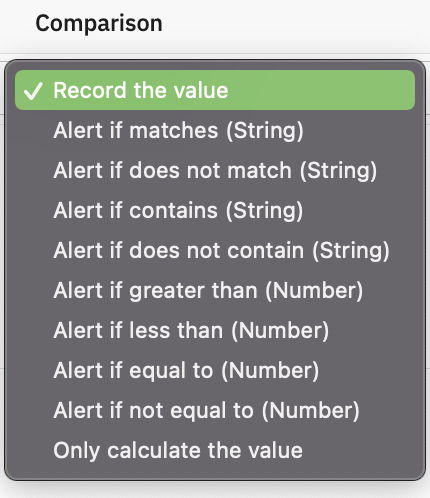 Full List of Comparison Options
Once you've chosen your comparison and value, select the alert level that will trigger if the conditions you've set are met. Choose the data type that best fits with your values, set scale and postfix values if they apply, and then you're ready to start configuring the event monitor's other options.
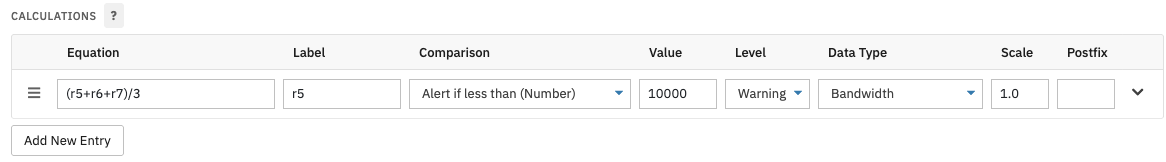 Complete Calculation Field with Labels
The first option, as usual, will alert you if the graph data points you've chosen are not found. Check this box and select the level of alert you would like to receive.
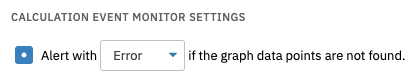 Data Points Not Found Alert Option
The next option will let you know if the graph data points used are older than a specified time span. This helps to ensure that the data points used in the calculation were collected around the same time. Doing so makes sure the results of the calculation are based on consistent data. You can set time spans in seconds, minutes, hours, or days and specify different time spans for each alert level. This option is made flexible to conform to any use case, as different data points will be relevant for different spans of time.
 Time Span Options
Select the third checkbox to include a table of all graph data points in the report generated by the Calculation Event Monitor each time it runs. You have the option to include it before or after any event text that's generated.
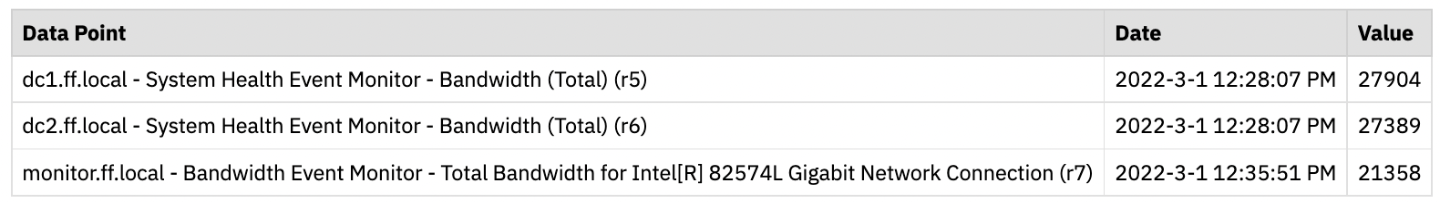 Summary Table
The last checkbox, when selected, lets you include a table of the result data in the event monitor's report. You can choose to place the table before or after any generated event text. There's also an option to use colors to indicate result status for easy reading.
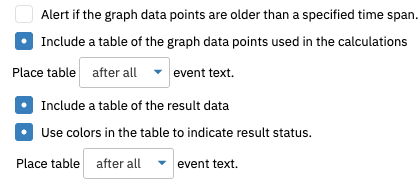 Result Table Options
Make sure to save your changes, and your event monitor is ready to run!
In this tutorial, we showed you how to use the Calculation Event Monitor and provided a use case example. The sky is the limit when it comes to what kinds of calculations the event monitor can perform, so we encourage you to get creative. Stay tuned for more new tutorials coming soon to the Features page! Refer to our Calculation Event Monitor reference guide for more documentation on this event monitor.
More IT Monitoring Features