The two alert panels mentioned in this tutorial let you ascertain at a glance an overall view of current alerts and status. The List of Current Alerts panel is a dynamic list of all or a selected group of current alerts. The Current Status panel shows a concise overview of the number of active alerts in real time. This tutorial will help you better understand the differences between the two, as well as how to integrate them into the dashboards you build.
The List of Current Alerts panel is very similar to the Headquarters section of FrameFlow itself but with a key difference. Here, you'll find a list of active or suppressed alerts, depending on how you configure the panel. Having this information readily viewable on your dashboard empowers you to take action sooner to resolve the reported issue.
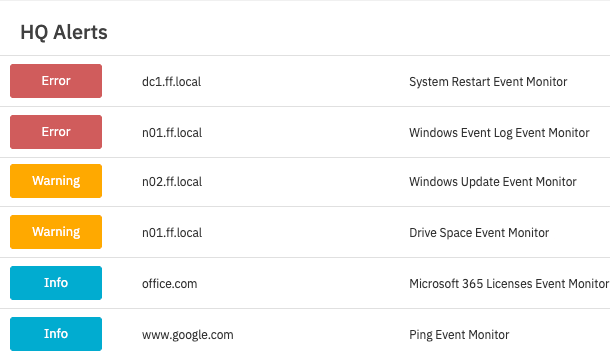 List of Current Alerts Panel
The difference between the information displayed here and what's available in the Headquarters section is that the data here can be sorted in whatever order fits your purpose. Some users will dedicate an entire dashboard to two Current Alerts panels: one for active alerts and one for suppressed alerts. Including a Current Alerts list panel devoted entirely to suppressed alerts creates a space for these otherwise easily forgettable alerts to be viewed.
Customize your dashboard panel by adding a title, icon, custom font/font size, etc. When you're happy with how your panel looks, you can decide how to filter the information that is displayed.
Under "show", you can choose the alert data you'll be displaying on the panel. If you choose "Active Alerts", you can further refine the content of your panel by the network device or event monitor the alert came from and the severity of the alert. Use these refining options to create a panel focused solely on your most important monitors and devices.
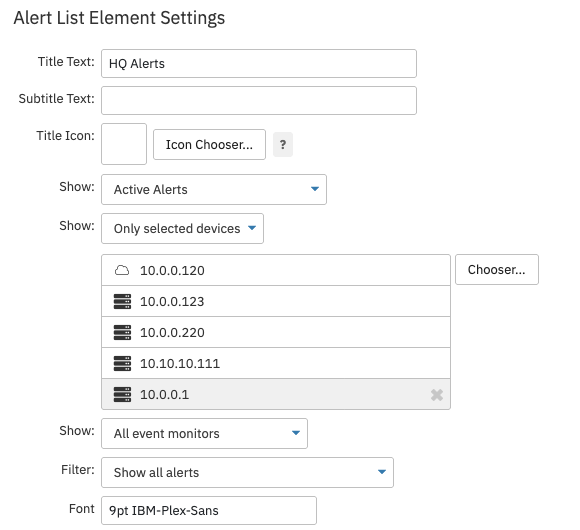 List of Current Alerts Settings
There are three different options to show only suppressed alerts, each of which serves a different purpose. You can choose to show all suppressed alerts or choose between temporarily suppressed alerts and those that have been suppressed indefinitely. Because you can have more than one List of Current Alerts panel on a dashboard, it may be beneficial to include one that highlights suppressed alerts. All three of these selections have the refining options from the "Active Alerts" type as well.
The last option will show only those alerts that have been assigned to a member of your team. This is a great way to remind yourself and your team of who's tackling what issue.
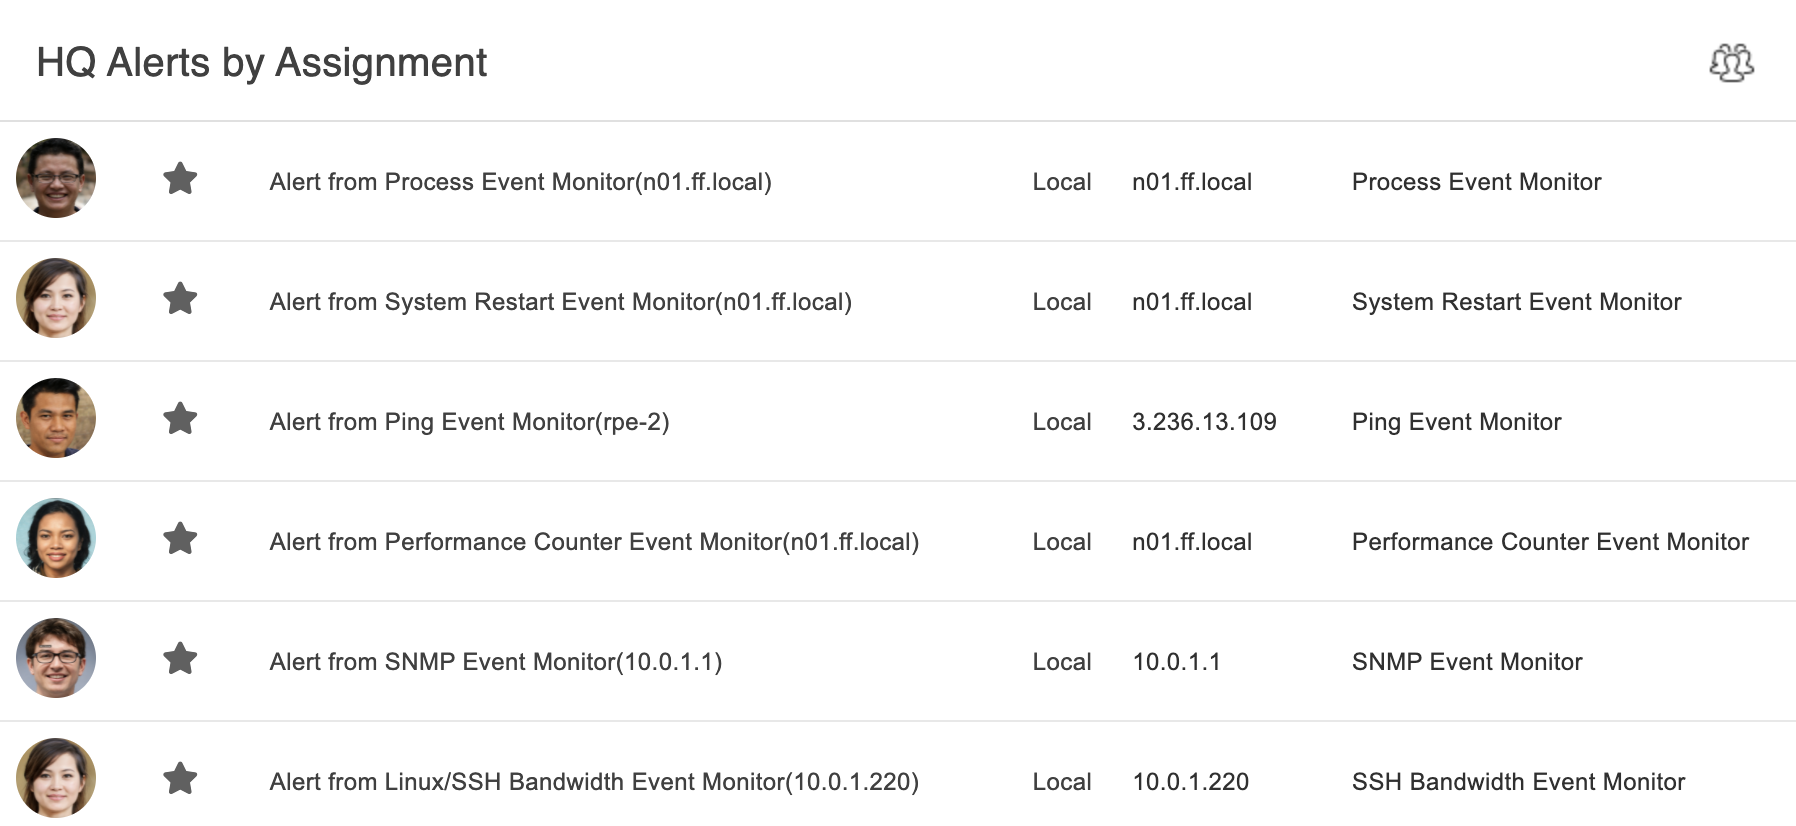 List of Assigned Alerts
The Current Status panel correlates one-to-one with the color-coded numbers in the top right of your FrameFlow instance.
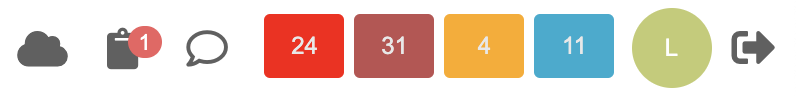 Current Status Counters
This dashboard panel shows the current number of alerts for each alert level. Blue represents info, yellow represents warning, orange represents error, and red represents critical, just like any other place within the FrameFlow interface.
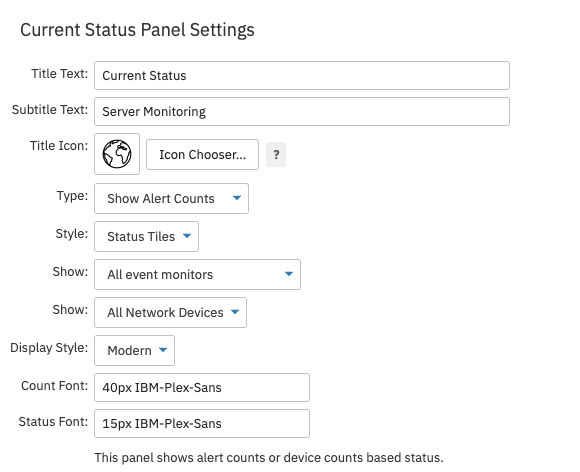 Current Status Settings
The Current Status panel lets you choose whether you want to show alert counts (the total number of each type of alert) or device counts (the number of devices in each alert state). The device counts option will also show you the number of devices that are in success states or paused. When viewing the number of devices in each state, you can also choose which network devices to include or exclude from this panel using the "Show" setting. This helps you gather data from only the most important network devices.
 Changes Over 4 Hours
You can also choose a custom label and icon to represent your dashboard panel, as seen above.
The "Style" option in the Current Status settings offers a choice of three styles: status tiles, status ring, and status bar, shown in order below. These options let you customize the look and feel of your dashboard panel.
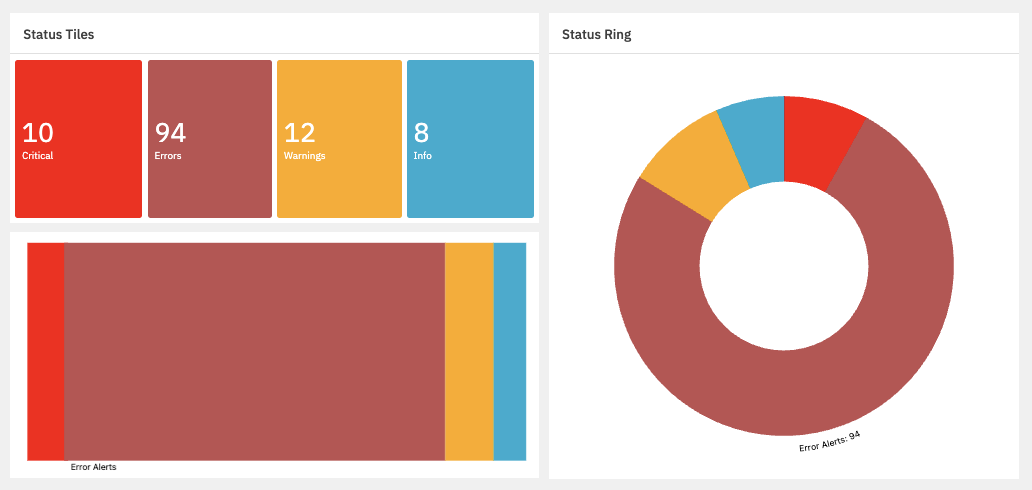 Each Style of Current Status Panel
If a section of your Current Status panel is large enough for a label, it will be labeled according to its color coded alert type, as seen above. If a section is too small to fit a label, hover over it to view its label.
 Hovering Over Labels
In this tutorial, we taught you about the two types of dashboard panels that convey alerts and their status: the List of Current Alerts panel and the Current Status panel. Now, you can implement them in your own dashboard configuration. Make sure to check the features page for more information on different types of dashboard panels coming soon!
More IT Monitoring Features