The Event Monitor Queue panel is an under-the-hood view of operations that shows the checks your event monitors are making in real-time. Event monitors in your configuration are always running checks in the background, but it's another thing altogether to see it in action. Read on to learn how to add this panel to your dashboard and take advantage of this behind-the-scenes view.
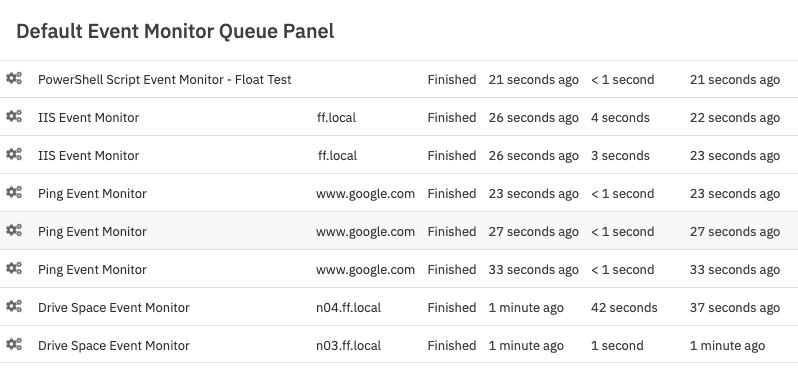
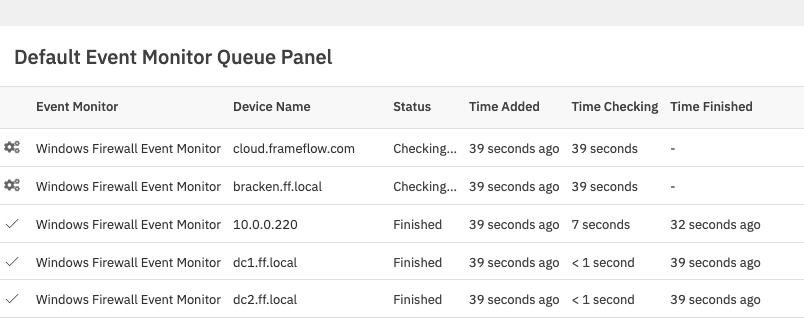 Sample Queue Panel with Default Settings
When creating your first Event Monitor Queue Panel, you can choose a title, subtitle, and icon of your choice. Select your preferred display style. The default option presents the data in a table, with event monitor processes appearing and then dropping off the list as the checks are completed. You can also choose a data point count, pie chart, stream graph, or a list of key metrics to be displayed instead. We encourage you to experiment with each display style to figure out which is best for your purposes.
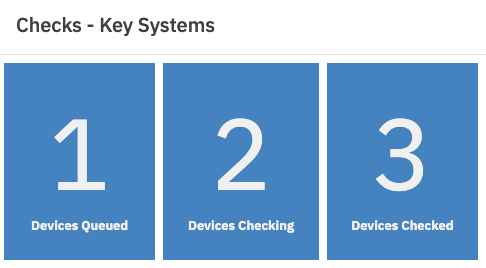 Key Metrics Style Panel
Stream graphs in particular can be used to add visual interest to your dashboards. Hovering over a stream graph will show you the number of checks in progress during that time.
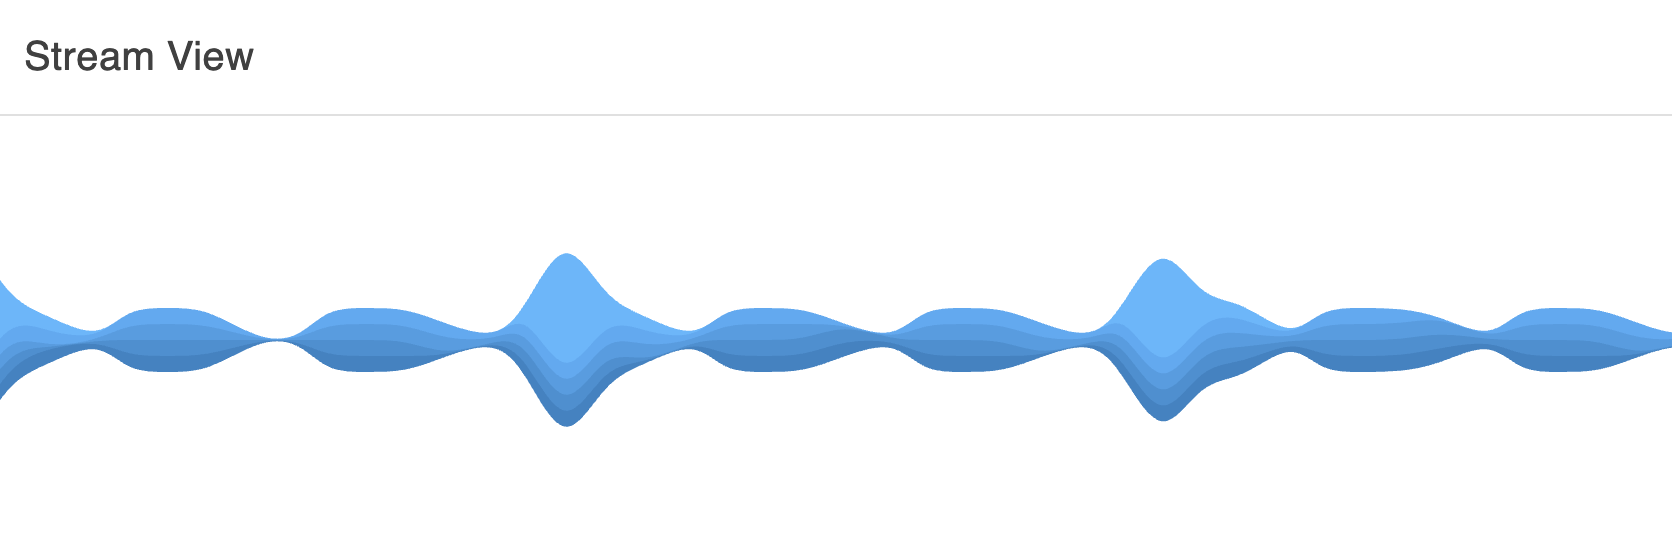 Stream Graph Style Panel
Using a key metrics style panel adds a visual element as it constantly updates the number of event monitors in each category: queued, checking, and checked.
 Key Metrics Panel in Action
Other options become enabled depending on what style of panel you've selected. For some, you can choose the font, font size, and color of your panel. For others, you can choose the duration (stream graph) or the time frame from which to gather data (data point count). Experiment with these additional options to create the display that you want.
Under "Show", choose the kind of data you want to display: details of checks in progress, summary of checks in process, or archive of completed checks. The most detailed of the three types is the first option. It shows a detailed table (or chart, or graph) of the checks that your event monitors are performing right now. The summary of checks in progress shows only the event monitor and its queue status. The archive of completed checks serves to document previous event monitor checks.
 Archive of Completed Checks
This tutorial taught you how to set up an Event Monitor Queue panel to use on your dashboards. Make sure to check out our other dashboard panel tutorials to gain the knowledge needed to create beautiful and informative dashboards containing all your most important metrics.
More IT Monitoring Features