The IIS Event Monitor checks a set of commonly used IIS web server performance stats and allows you to set thresholds for bytes sent and received per second and the number of current connections. You can also set thresholds based on the request type.
Check the first box and select an alert level if you want to be notified if the event monitor cannot contact the server.
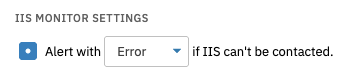 IIS Monitor Settings
You can choose to be alerted if the site you are trying to contact is stopped by checking the second box and specifying an alert level. Manually select the sites you want to monitor by checking the box titled "Only Check Selected Sites" and typing the names of the sites in the corresponding text box. Separate different sites with a comma.
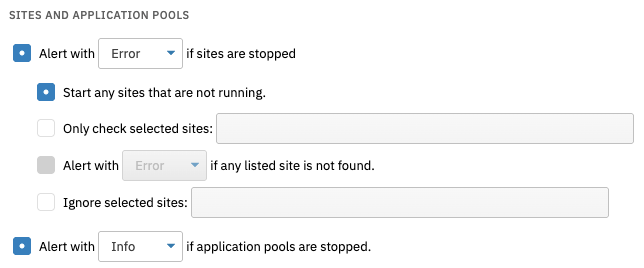 Sites and Application Pools Settings
Next, specify an alert level for the event that any of your listed sites are not found. This will notify you in the case of accidental deletion, for example. You can also set an alert level to notify you if application pools are stopped. If you choose to do so, a new option will appear that lets you check only the application pools whose names you type into the adjoining text box.
After setting alert levels for the settings above, you must choose a protocol. Using the default, WinRM, will be the best option in most cases. Leave this value at its default unless FrameFlow Support asks you to do otherwise.
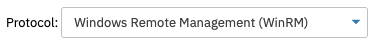 Protocol Settings
The IIS Event Monitor keeps track of a host of performance counters as well. The list you see in the event monitor's settings contains the performance counters that Microsoft recommends for monitoring. Select any number of these to monitor within the IIS Event Monitor, or check out our Windows Performance Counters Event Monitor for more in-depth performance counter monitoring.
In this event monitor, monitoring the "Bytes Sent" counter is as simple as clicking the check box. A list of options will appear below, allowing you to set alert levels to notify you when the total bytes sent either exceeds or drops below a number you specify. The "Bytes Received" and "Bytes Total" performance counter options work the same way.
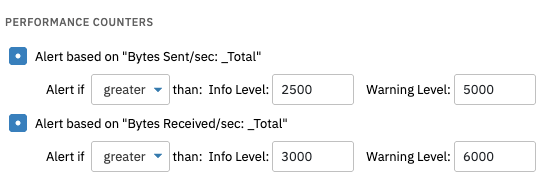 Performance Counters
When using WMI to monitor sites and application pools, make sure to use the Windows Server Manager to ensure that the "IIS Management Scripts and Tools" role services are installed on the systems you want to monitor.
When using the WinRM protocol, a configuration change is required to retrieve site and application pool data on systems that were added by using their IP address. To connect to systems using their IP address, open an administrative command line window on your monitoring server (and remote nodes on a multi-site configuration) and run the following command:
winrm set winrm/config/client @{TrustedHosts="*"}
In this tutorial, we showed you how to use an IIS Event Monitor. We introduced you to the setup process and taught you what protocol to use, then gave some tips on how to run the event monitor smoothly. Refer to our IIS Event Monitor reference guide for more documentation on this event monitor. Stay tuned for new tutorials coming to FrameFlow's Features section in the coming days and weeks!
More IT Monitoring Features