The Installation Health Event Monitor is a tool that checks the overall health of the system where FrameFlow is installed. It's recommended for your main console and, in multi-site configurations, for all remote nodes. Use it to receive alerts about monitoring actions that seem to be taking too much time, disk space, CPU usage, and more.
The first two available options alert you when contact is lost or regained with the remote node.
 Lost Contact Monitoring Options
Select the level of alert that will be given if any monitoring action seems to take a long time to complete.
 Monitoring Queue Alert Option
The second option will alert you if the remote node update service is not running. This option is available only to remote node users.
 Update Service Option
The next option is also remote node only. It will alert you if posting data to the master console takes too much time to complete.
 Master Console Option
Other Monitoring Options
The Installation Health Event Monitor also alerts based on key health metrics like memory and disk space. Set the alerting parameters you want to use for memory percentage and the amount of disk space used. The disk space option also has a "Drives to Ignore" field in which you can enter the names of drives that will not be checked.
 Memory and Disk Space Options
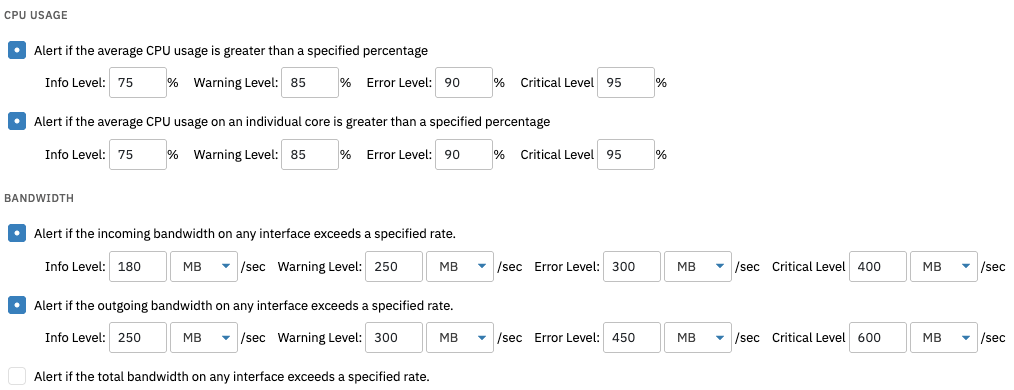
The other health metrics the event monitor reports upon are CPU usage and bandwidth. You can receive alerts about average CPU usage as well as usage on a per-core basis. Enter the incoming, outgoing, and total bandwidth rates that will trigger each level of alert. Under bandwidth monitoring, an "Interfaces to Ignore" text field lets you exclude a comma-separated list of interfaces from monitoring.
 CPU Usage and Bandwidth Options
The final installation health monitoring option monitors the size of your log file. Enter the log file sizes that will trigger each alert level, like below.
 Log File Size Options
This tutorial taught you how to set up a new Installation Health Event Monitor and configure its settings. Now, you can be sure that the system where FrameFlow is installed is in perfect condition, enabling you to monitor everything else with confidence. To view more documentation on this event monitor, visit its Technical Resources guide.
More IT Monitoring Features