The PowerShell Script Event Monitor runs Windows PowerShell scripts that you can develop to monitor conditions that are specific to your environment. This event monitor lets you write custom monitoring actions using Windows PowerShell and integrate them fully into our monitoring and notification engine. A sample script is provided to help you get started.
First, create a new PowerShell Event Monitor and select the network devices you would like to monitor.
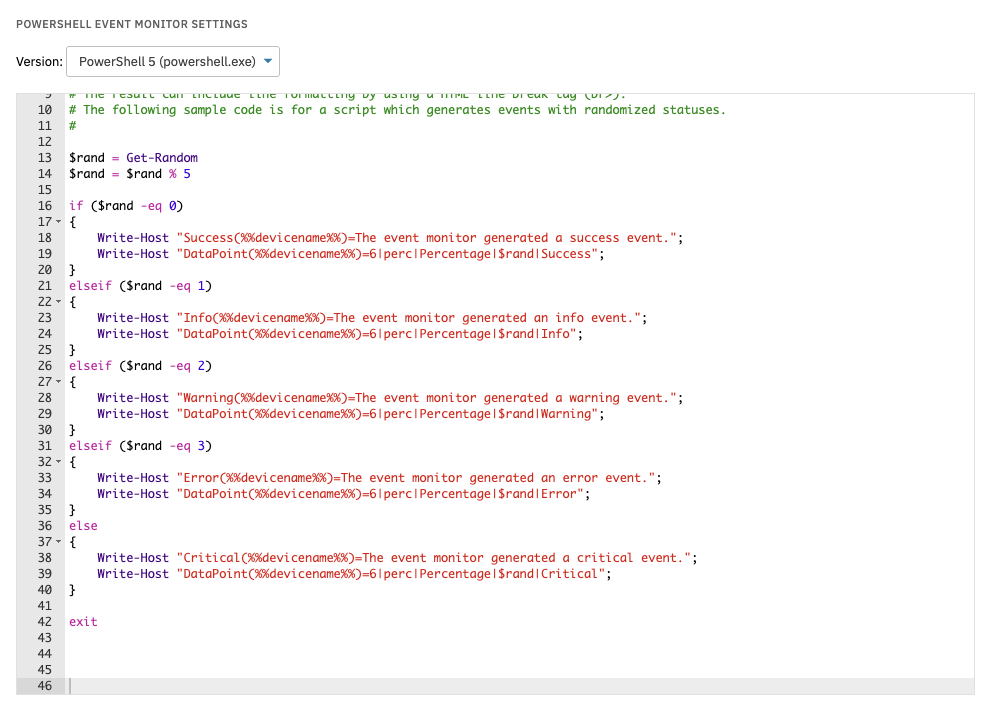
The sample script will trigger a randomized alert each time it runs. The code is useful when used as an example to create your own unique script.
Sample Script
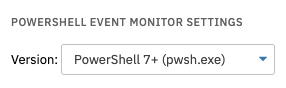
You can then choose the PowerShell version you want to work with. Note that the "PowerShell 7+" option works with PowerShell version 7 and later.
Sample Script
To help you develop your script, the event monitor includes a full code editor with syntax highlighting specifically designed for PowerShell scripting.
Notice that the script includes a variety of tokens that are marked with two percent signs on either side of the token name. One of the most important tokens is the %%devicename%% token. When the event monitor runs, it will run your script once for each device you selected, replacing the token %%devicename%% with the name of the device.
In addition to the device name, your script also has access to the display name, IP address, device tags, monitor tags, and more. The tokens %%deviceusername%% and %%devicepassword%% will retrieve values from the device's authentication profile, thereby eliminating the need to hard-code usernames and passwords in your script.
You can find a full list of tokens below, or visit the support link at the bottom of the sidebar of your FrameFlow installation. Note that you can also use <br> tags to make sure the text that is generated with each event monitor run doesn't all appear on one line.
| %%devicename%% | The name of the device that generated the event |
| %%devicetag=xyz%% | Replaced with the value of the specified device tag. For example, "%%devicetag=contactname%%" might be replaced with "John Smith". |
| %%deviceusername%% | Replaced with user name from the authentication profile assigned to the device. |
| %%devicepassword%% | Replaced with password from the authentication profile assigned to the device. |
| %%devicetag=xyz%% | Replaced with the value of the specified device tag. For example, "%%devicetag=contactname%%" might be replaced with "John Smith". |
| %%displayname%% | The display name of the device or just the device name if there is no display name |
| %%devicegroup%% | The name of the group in which the device resides |
| %%ipaddress%% | The IP address of the device that generated the event |
| %%monitortag=xyz%% | Replaced with the value of the specified monitor tag. For example, "%%monitortag=location%%" might be replaced with "New York". |
Script Execution
It is important to note that the script will be run on the FrameFlow server. If it needs to act a network device, you'll need to write code to connect to the device and get the information you need. The %%deviceusername%% and %%devicepassword%% fields can be very helpful for this.
Script Output
Your script can perform any type of check that you want. The only requirement is that it produces output in a specific format that FrameFlow expects.
The expected format is:
Status(devicename)=Event message
In the above example, "Status" must be one of "Success", "Info", "Warning", "Error", or "Critical", indicating the status level for the alert. The value "devicename" is the device name to associate the event with. The %%devicename%% token is typically used to populate this field. The value "Event message" is the complete text that you want to include in the generated event.
Here is a complete example of valid output for a script:
Warning(n05.frameflow.local)=The average CPU usage has exceeded 80%.
The output must be all on one single line. To format event text with multiple lines, use standard HTML <br> tags, as shown in the following example:
Info(n22.frameflow.local)=Line 1<br>Line 2<br>Line3<br>
Generating Data Points
In the above section, we showed you the output format required for your script and explained how that output is used to produce events and alerts in FrameFlow.
Our PowerShell Event Monitor can also generate graph data points based on the output of your script. Data points can be used to populate dashboards, graphs, and reports in the FrameFlow interface.
The expected output to generate a graph data point is as follows:
DataPoint(%%devicename%%)=data-type|data-name|data-label|data-value|status-level";
In the above example, "data-type" is a number telling FrameFlow how to format the value that comes later. Examples include "0" for milliseconds and "4" for file size. A table of data type values is included below.
The "data-name" item is a short name for the data point, like "CPU". Keep it short and use only letters and numbers. Avoid spaces and other non-alphanumeric characters. This value does not appear in the FrameFlow interface.
The "data-label" item is a longer descriptive name for the data point like "CPU Usage". You can use spaces in the data label.
The "data-value" is the raw value for the data point. For example, "55.8".
Finally, the "status-level" item is the alert level to associate with the data point. It can be one of "Success", "Info", "Warning", "Error", or "Critical".
Here is sample output that generates a data point for a detected CPU usage value:
DataPoint(n37.frameflow.local)=6|cpu|CPU Usage|55.8|Warning
Your script can generate multiple data points by including additional output lines. For example:
                    DataPoint(n37.frameflow.local)=6|cpu|CPU Usage|55.8|Warning
                    DataPoint(n37.frameflow.local)=6|diskc|Disk Usage C:|81.6|Info
                    DataPoint(n37.frameflow.local)=11|bandwidth|Bandwidth eth0|98213892|Info
Generated data points will be viewable in the Graphs tab of the event monitor.
Data Types
The following table shows the data types supported by our PowerShell Event Monitor:
| 0 | milliseconds |
| 1 | integer |
| 2 | floating point value |
| 3 | success/failure (value must be 1 or 0) |
| 4 | a file size in bytes |
| 5 | bandwidth in bytes per second |
| 6 | a percentage |
| 7 | a rate per second |
| 8 | a date in seconds (Unix time/time_t) |
| 9 | a time span in seconds |
| 10 | a string value |
| 11 | bandwidth measured in bits per second |
| 12 | temperature in Fahrenheit |
| 13 | temperature in Celcius |
| 14 | watts |
Sample Scripts
FrameFlow includes a set of example PowerShell Event Monitors for different monitoring tasks. You can use them as is or as the basis for your own custom PowerShell Event Monitor. You can find these in the PowerShell library, accessible by opening the "Add Event Monitor" menu.
PowerShell Library Location
With this event monitor, you'll rarely need to use an authentication profile. For most purposes, you'll use the default value of "-- None --". For authentication, it is typically best to use the %%deviceusername%% and %%devicepassword%% tokens directly in your script but there are some rare cases where you may need to use an authentication profile instead. Reach out to FrameFlow's support staff if you need assistance with authentication.
This tutorial introduced you to the PowerShell Event Monitor. We taught you how to set one up, showed you the tokens to use, and gave you examples of the monitoring tasks possible with just a bit of PowerShell scripting. Please do not hesitate to contact the FrameFlow team if you need help writing script to monitor a certain aspect of your network devices and stay tuned to the Features section for new tutorials! Refer to our PowerShell Script Event Monitor reference guide for more documentation on this event monitor.
More IT Monitoring Features