FrameFlow's robust Reports section is home to completely customizable reports on various IT monitoring metrics. Here, you can receive up-to-date reports on the daily functions of your various event monitors and devices. Every FrameFlow installation comes with five default report types: CPU usage, memory, disk usage, ping response time, and bandwidth. You can also create custom reports. This tutorial will familiarize you with the Reports section so you can begin using it to its full potential.
To add a new report, go to the Reports section in the left-hand menu of your FrameFlow installation and right-click anywhere in the tree structure. From the resulting menu, choose "New Report".
 Adding a New Report
In this new window, configure the settings of your report. Here, you can add a name for your new report as well as a date range. This date range will only apply to certain types of reports (like graphs). Other report types act more like a snapshot in time from when the report was generated, showing how conditions were at one moment in time instead of a range of time.
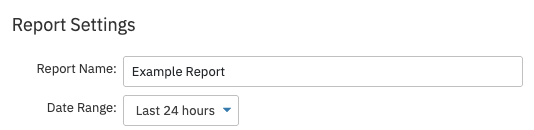 Report Name and Date Range Settings
For reports that use date ranges, you can choose to group the data by hour, day, 15-minute interval, etc. For example, if you chose to group data by hour, each data point on the resulting graph would represent one hour. What values you choose for this and the date range option above will depend on the kind of data you're collecting and what makes sense for your purposes. By default, your reports must be updated with fresh data manually, but you can also use the final option in the Report Settings to update your reports on a set schedule.
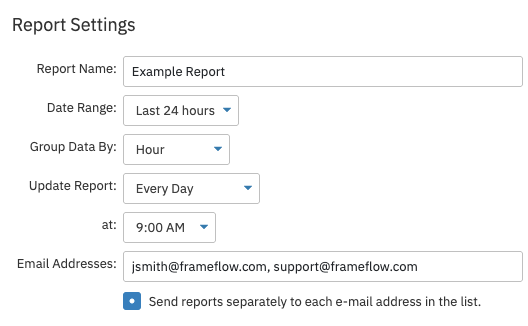 Other Settings
The Report Settings window also has a text box where you can enter the emails of individuals you'd like to receive the reports as a PDF as they're built. Separate each email with commas. Check the box below this option to send the reports to each email address separately instead of as one email with multiple recipients.
Creating a Custom Report
Even after filling out all the above options and clicking "OK", your report is still a blank slate. To remedy this, right-click on your blank report and select "Add Report Element". Here, you can fully customize the report. By hovering over each report element, you can view a brief explanation of each type. Once you've added report elements, you can rearrange them by dragging and dropping.
 Report Element Descriptions
Once you're happy with the layout and elements of your report, use the Actions menu to select "Finished Editing" to exit build mode. Next, use the Actions menu again and select "Build Report Now". After a few moments, your new report will be completed! There's another Actions menu option to download the report as a PDF if you so desire. You can also access a print-friendly version from the Actions menu. To edit your report's layout, just select "Edit Report" and make any changes you need. Once you're done with these changes, hit "Finished Editing". Note that unless you've scheduled regular updates for this report, it'll always be displaying the same information from the time at which you built the report. To refresh the data, you'll have to click Actions > Build Report Now again.
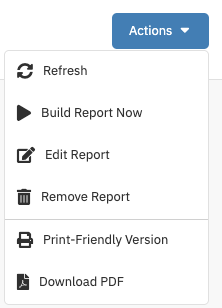 Actions Menu
This tutorial was created to shed some light on our powerful but often-overlooked Reports section. For more documentation on Reports, check out our blog post on the default report types. We add new tutorials on the Features page regularly, so keep an eye out for more comprehensive instructions coming soon.
More IT Monitoring Features