The SNMP Event Monitor can watch any value supported by your networking gear and other equipment that supports SNMP. It has a wide variety of options supporting SNMPv1, SNMPv2, and SNMPv3. To select the items to monitor you can use either the numeric OID for the value or (if the matching MIBs are present) a symbolic name.
To view a video version of this tutorial, view our SNMP monitoring video.
To begin, select the SNMP devices you want to monitor. Next, select your SNMP profile. There is an option to use custom settings as well, but for most purposes, we recommend using an SNMP profile. Choose your SNMP version next. We support versions 1, 2, and 3. The community is a type of shared password between the SNMP management station and the device. Enter yours in the designated text box. Choose your port number, timeout, and the number of retries the monitor should perform before giving up trying to connect.
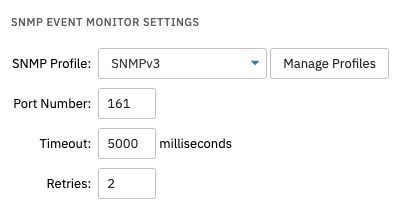 Connection Settings
Select the level of alert you want to receive if the event monitor cannot contact your SNMP-based devices. Select the alert level you prefer if the SNMP values aren't found. You can also choose to include a table of the result data before or after the event text available after the monitor runs. There is also an option to color-code the result data to indicate status.
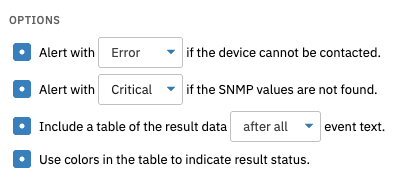 Event Monitor Settings
Enter the OID/symbolic name for the value you want to monitor. Then, enter a label. This is optional, but if you enter a label, this value will be displayed in events, alerts, and reports instead of the OID/symbolic name. Then, select the comparison type that makes sense for your purposes. Enter the value to be used for the comparison, then the data type. This tells the event monitor how to interpret the value when displayed in graphs and reports.
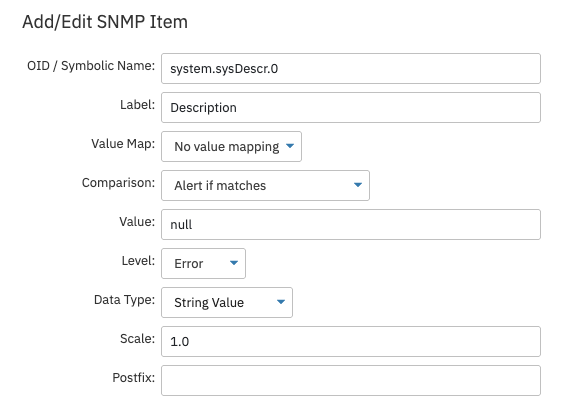 Items to Monitor Section
Finally, enter the scale and postfix to be used. Both are optional, but the metric will be multiplied by the specified value before the comparison is checked. The postfix qualifies the retrieved value. If the generated number has to do with time, you would specify "ms", for example.
This event monitor also supports customized equations. Enter the calculation for the value you want to monitor. The below example is set up to monitor average temperatures across SNMP-based devices and alert if it exceeds 41 degrees celsius. You can reference values from the Items to Monitor table by using the label field. If you want to, add a label that will replace the equation in events, alerts, and reports. Select the comparison, value, and data type, defined above. Add a scale and postfix.
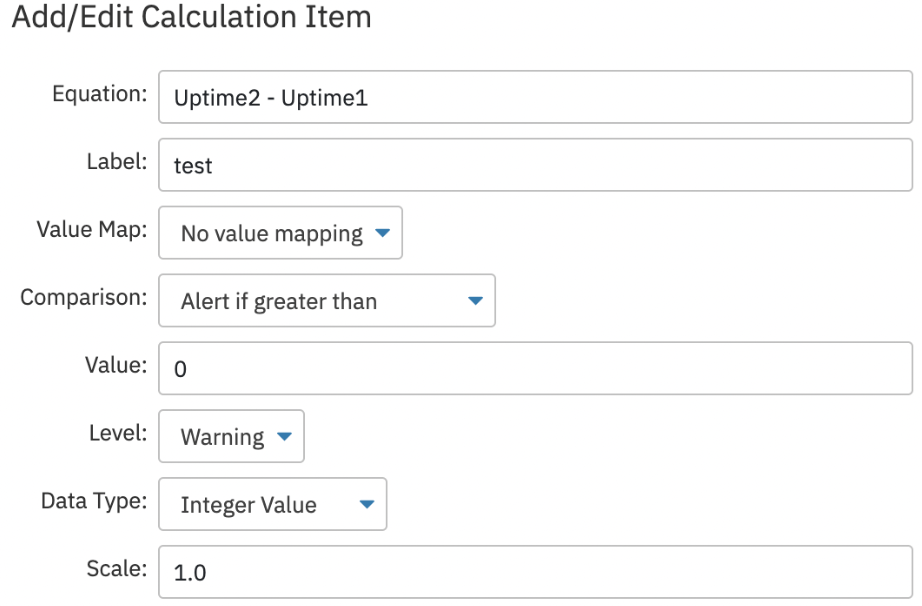 Calculations
Now that you know how to set up an SNMP Event Monitor, you can begin monitoring all necessary SNMP-based devices. We told you how to set up connection settings, items to monitor, and how to create custom equations. Keep an eye on the Features page for a new batch of tutorials coming soon! Refer to our SNMP Event Monitor reference guide for more documentation on this event monitor.
More IT Monitoring Features