This tutorial shows you how to set up a SQL Server Event Monitor and check database contents. For a tutorial on the similarly named MySQL Event Monitor, click on the provided link.
This event monitor can make sure the database server is available and can run SQL queries checking the results for specified values. It also checks the sizes of database transaction logs and alerts if they exceed either a specified size or a specified percentage full.
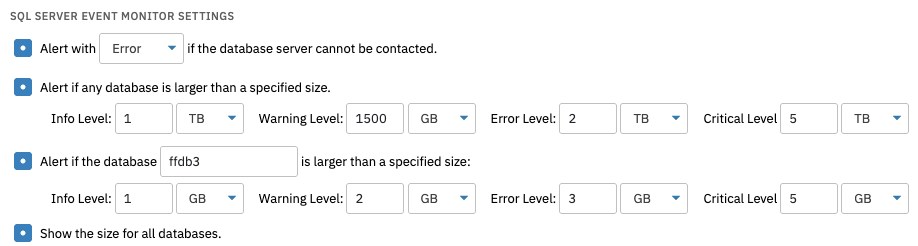
As always, this event monitor offers the option to alert you if the database server cannot be contacted. The next option will let you know if the database exceeds the size you specify. You can enter values that will trigger each alert level, but keep in mind you can leave some alert levels blank if you do not need them. Checking the option to alert if a certain database has exceeded a specified size will open a dropdown menu that allows you to select sizes that trigger different alert levels. Enter the name of the database in the blank text box.
 SQL Monitor Settings
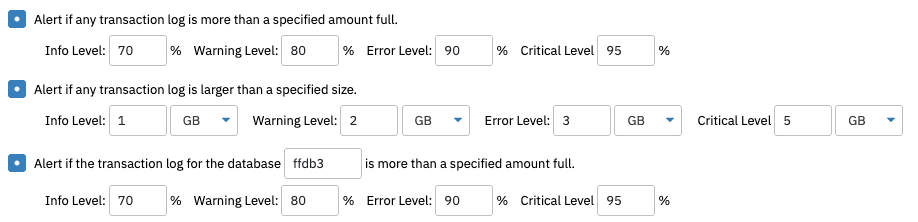
Select "Show the size for all databases" to include an up-to-date report on the size of your databases with each notification. The next four options alert based on database sizes and percentage used. This event monitor allows you to check all databases for size and percent used and will alert you if any of them exceed the values you have entered. For an added level of specificity, you can also enter specific database names you would especially like to keep an eye on. This feature can monitor for either database size or percentage used as well.
 Database Settings
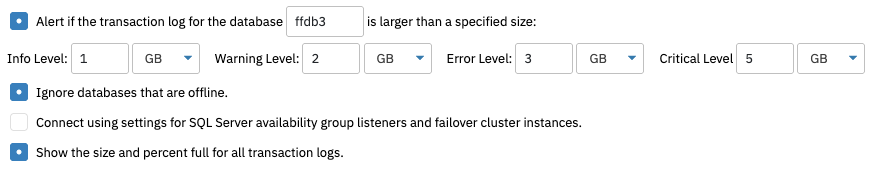
The next option will omit alerts about databases that are offline. You also have an option to connect using settings for SQL server availability group listeners and failover cluster instances. If you're using an availability group or failover cluster, turn this option on if the default settings will not allow you to connect. Select "Show the Size and Percent Full for All Transaction Logs" to receive that information in each SQL Server Event Monitor notification.
 More Settings
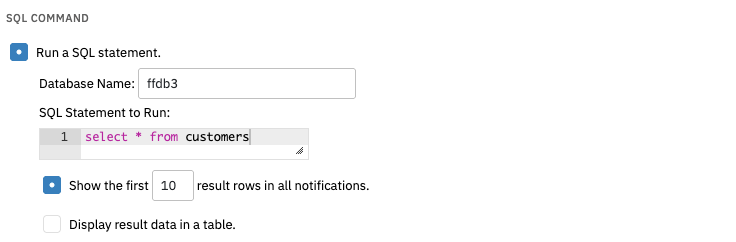
Expand the check box called "Run a SQL Statement" and more options will be revealed. There is a text box available to enter the name of your database and one to enter the SQL statement you want to run. Specify the database you would like to receive statements for, then enter the SQL code in the larger text box. This will return a list of results you've specified in your code in your notifications each time the event monitor runs. The next option allows you to choose how many results you want to be shown in each notification. You can also choose to display your results in a table, with or without column names.
 SQL Command Field
There is an option to alert if a specified string of text is found in the results of the event monitor run. You can specify the number of rows to check, column number to check, and record set to check. You can also make the event monitor record data points for the values it finds when it runs. Expanding this check box will reveal fields for the label, record set, row, column, comparison, value, alert level, and data type. Clicking "Add New Entry" will create a new set of fields for you to fill out in addition to the first one. When filling out the record set field, remember that the first row in a record set is row #1 and the number of all the other rows proceed from there.
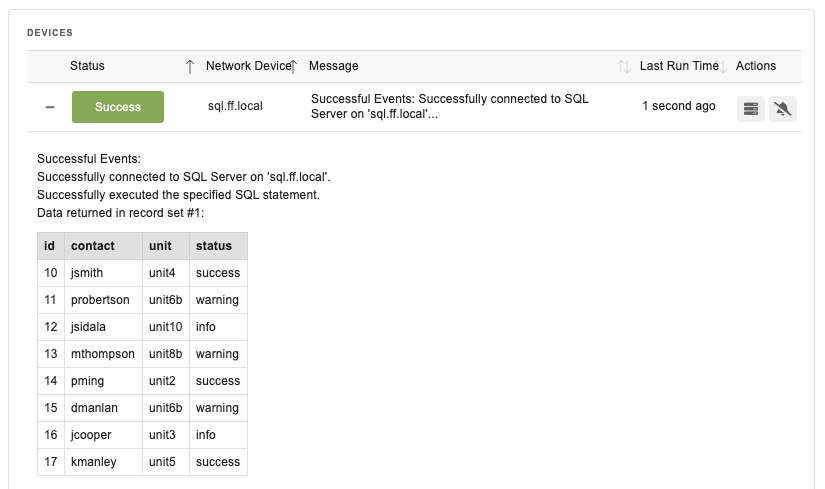 Data Set With Columns Included
Additionally, you can receive alerts if the number of records returned exceed a value you specify. You can also receive alerts if the query takes more than a specified amount of time to return results.
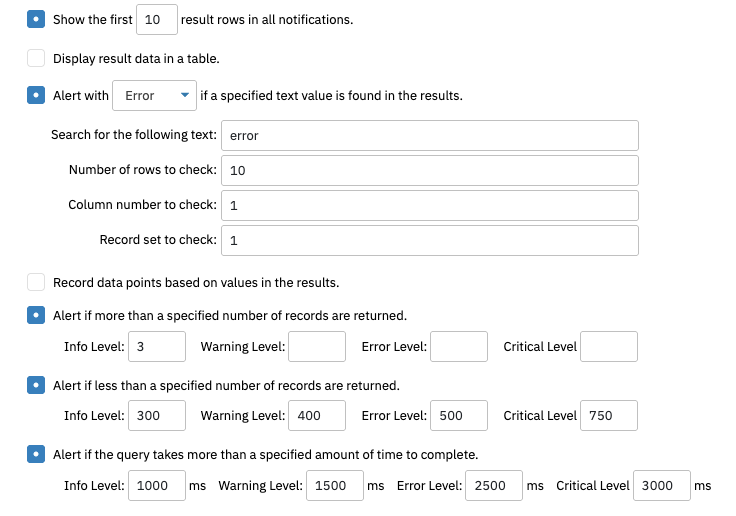 Results Settings
The last two options let you specify a time out for both connection and command, measured in seconds.
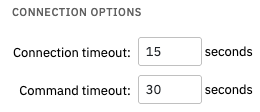 Connections Settings
The Authentication settings for the SQL Server Event Monitor are slightly different than those for other event monitors because SQL server provides multiple authentication options. Under Authentication, you can choose whatever device credentials you would normally use, but, unlike other event monitors, you also have the option to fill in an instance name. If you are using the default instance, leave this field blank. If not, enter the name of the instance you are using. This will tell the event monitor what instance to connect to. After specifying the authentication you want to use, choose between the two protocols: either named pipes or TCP/IP. Enter the TCP/IP port number if you select the TCP/IP option. It is crucial to double-check all values in this section because if any of them are wrong, the monitor will not be able to connect.
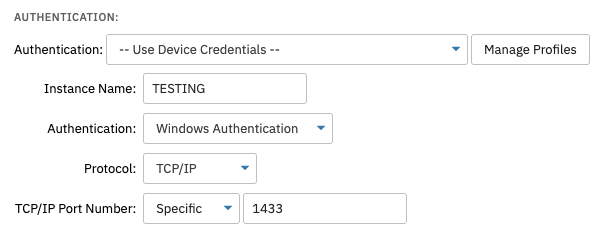 Authentication Section
In this tutorial, we taught you how to set up a SQL Server Event Monitor. We also went over how to authenticate with the event monitor and showed you the ins and outs of the settings. Refer to our SQL Server Event Monitor reference guide for more documentation on this event monitor. Refer back to the Features page of FrameFlow for more tutorials coming soon!
More IT Monitoring Features