For your Windows and Linux servers, the most important metrics to keep track of are CPU usage, disk space, memory usage, bandwidth, and ping response time. These five metrics are the fundamental indicators of a system's health.
FrameFlow has a built-in System Health Event Monitor that collects all five of these metrics in one go. In this tutorial, we'll show you how to set up a System Health Event Monitor and then use the data that it collects in your dashboards and reports.
To view a video tutorial instead, click here.
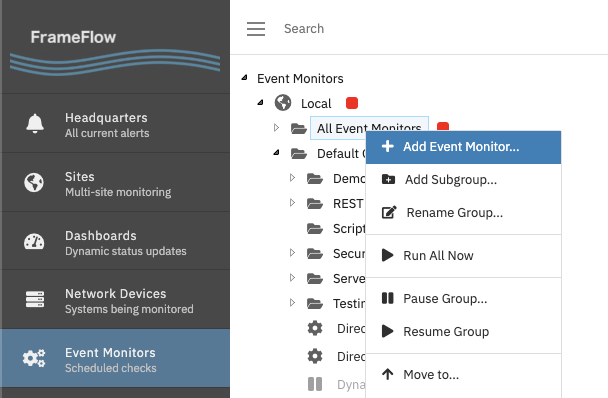
Start by selecting the Event Monitors section on the left, then right-click on "Default Group" and select "Add Event Monitor".
A window will appear with a list of all available event monitor types. The System Health Event Monitor will be listed at the top. Select it and press the OK button.
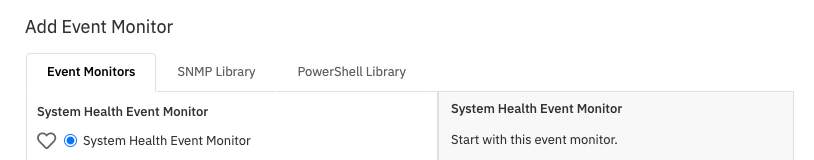
A new System Health monitor will be created and in the following steps, we'll learn about its settings and available options.
Use the "Description" field to give your event monitor a name, or use the default name provided. Next, use the Chooser button to select the servers you want to monitor.
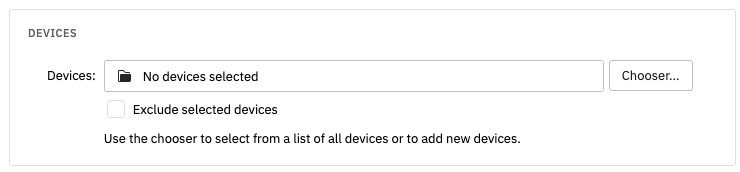
One System Health Event Monitor can monitor tens, hundreds, or even thousands of servers. For now, just select a handful. If you haven't already added any devices to your FrameFlow configuration, you can do that now using the "Add New" button in the device chooser.
In the settings section, you'll find options allowing you to set thresholds for each of the system health metrics. Since every monitoring environment is different, you get to start with a blank slate.
Select the checkbox beside one of the metrics and options will appear allowing you to set the thresholds for one or more status levels.
The thresholds you choose will be based on your personal preferences and the general properties of the systems you are monitoring. You don't have to specify thresholds for each status level. For example, if you only want error and critical alerts, provide thresholds for those status levels and leave the info and warning levels blank.
Each metric lets you specify certain systems that you don't want to check for that particular metric.
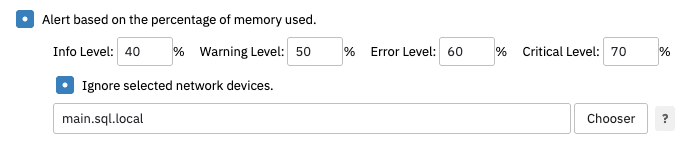
For example, servers running SQL Server and Microsoft Exchange will often continuously show memory use at 100%. That's because those apps optimize their performance by reserving as much memory as possible. You probably still want to monitor them for CPU, disk usage, and other metrics though. Using the exclusion option lets you monitor all your devices but skip those that have different runtime properties from the others.
FrameFlow is an agentless monitoring system. That means you never need to install anything on the systems being monitored. Instead, FrameFlow connects to your systems using industry-standard protocols, adhering to your network security policies.
The System Health Event Monitor needs credentials to connect and get the metrics that it monitors. Use the Authentication dropdown box to choose an authentication profile that the event monitor will use. If you have not yet set up any authentication profiles you can add one now using the "Add a New Profile" option in the dropdown box.
Now you're ready to save your settings which will create the event monitor and run it for the first time. While it runs, the gear icon in the title bar will spin. When it is finished running, the gear will stop spinning and a refresh icon will appear.
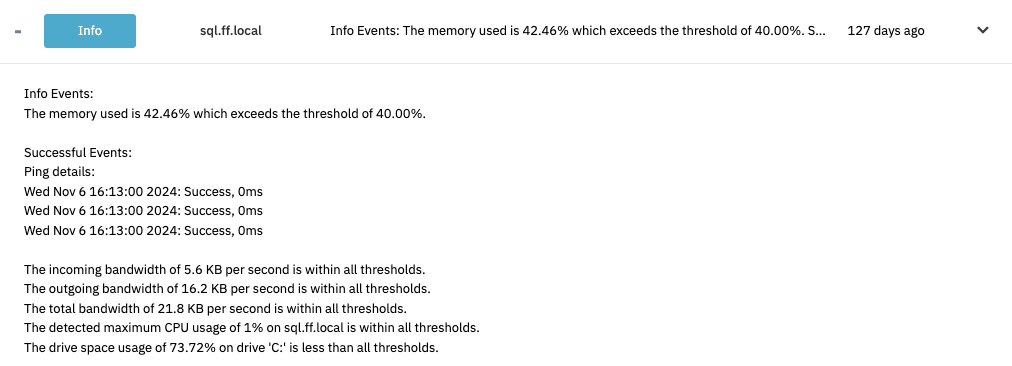
Select the Status tab for the event monitor and you'll see a list of results for each device. You can expand the row for any device to see the complete details.
The events and data collected by your System Health Event monitor can also be used to populate dashboards. Use the menu on the left to select Dashboards. Select the dashboard called "3. System Health Dashboard" to see your monitoring results.
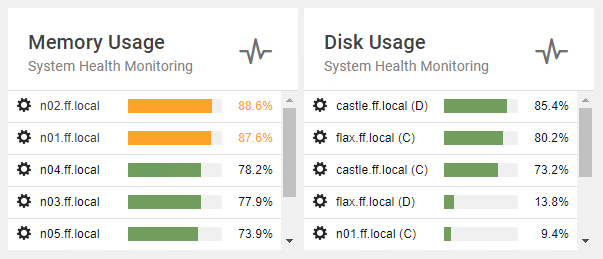
Dashboards are constantly updated, always giving you a view of current network status. Dashboards are also completely customizable and we'll cover more about that in a separate tutorial.
Reports are designed to give you a longterm view of system patterns. FrameFlow includes built-in reports that focus on each of the metrics tracked by your System Health Event Monitors.
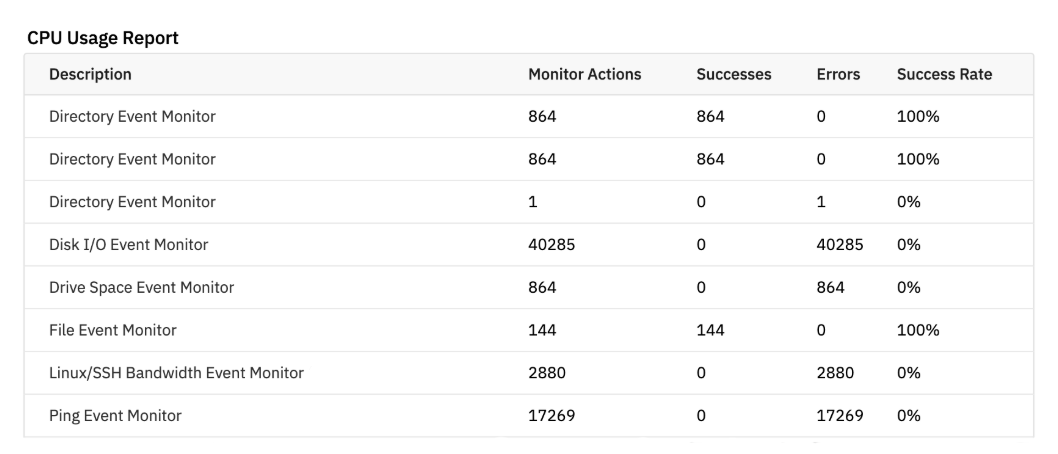
Use the menu on the left to select Reports. Right-click on the report called "CPU Usage Report" and select the "Build Report Now" option.
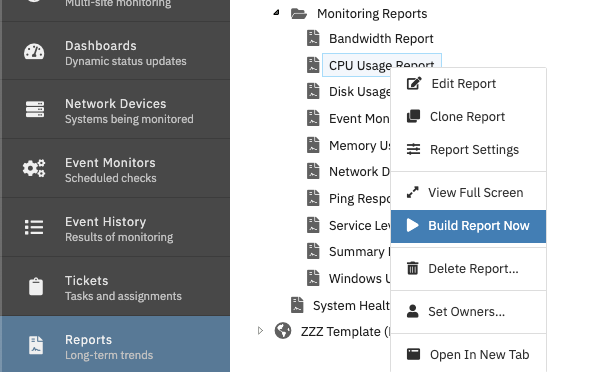
The resulting report will list average, minimum, and maximum CPU usage for every device that is being monitored by your System Health Event Monitors.
Reports are fully customizable. You can schedule them to be built on a regular basis and have them delivered to one or more email recipients as PDF attachments.
In this tutorial we showed you how to create a System Health Event Monitor, select the devices it will monitor, and choose thresholds for alerting. We also showed you how the data generated by your System Health Event Monitors can be used to populate dashboards and reports. Refer to our System Health Event Monitor reference guide for more documentation on this event monitor.
More IT Monitoring Features