SNMP Bandwidth Monitoring
SNMP has a reputation for being difficult, as anyone new to it would agree. It's a powerful protocol but it also brings with it many new concepts and sets of terminology. Sorting out the difference between OIDs, MIBs, symbolic names and community strings takes time but it doesn't have to be that way.
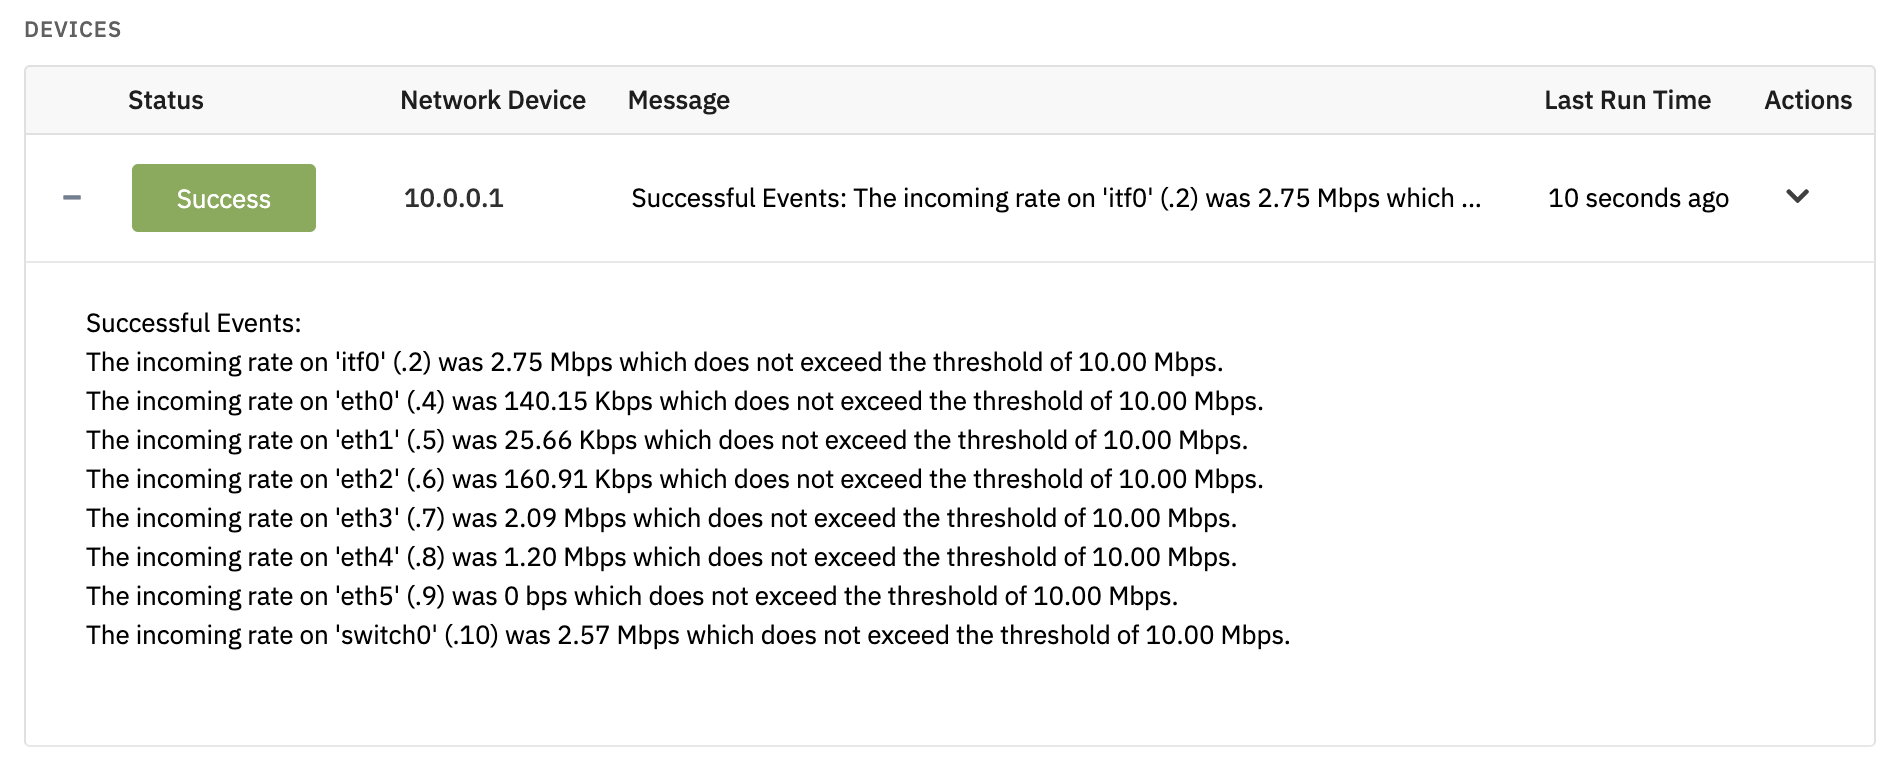
FrameFlow's SNMP Bandwidth Event Monitor hides all of the complications of SNMP and lets you get just the data you need. For more documentation on this event monitor, we offer a tutorial in both text format and in video format, so you can choose which one suits your learning style.
Point-and-Click Bandwidth Monitoring
To get started, go to the Event Monitors section in FrameFlow, right-click on a group in the tree and select "Add Event Monitor". Scroll down to find the "SNMP Bandwidth Event Monitor" and select it.
Next, select an SNMP profile to use. FrameFlow ships with default profiles for SNMPv1 and SNMPv2. For bandwidth monitoring, select the SNMPv2 profile because that version of SNMP has better support for monitoring high-bandwidth devices. If your SNMP device is using something other than "public" for its community string then you'll need to create a new profile or edit the existing one.
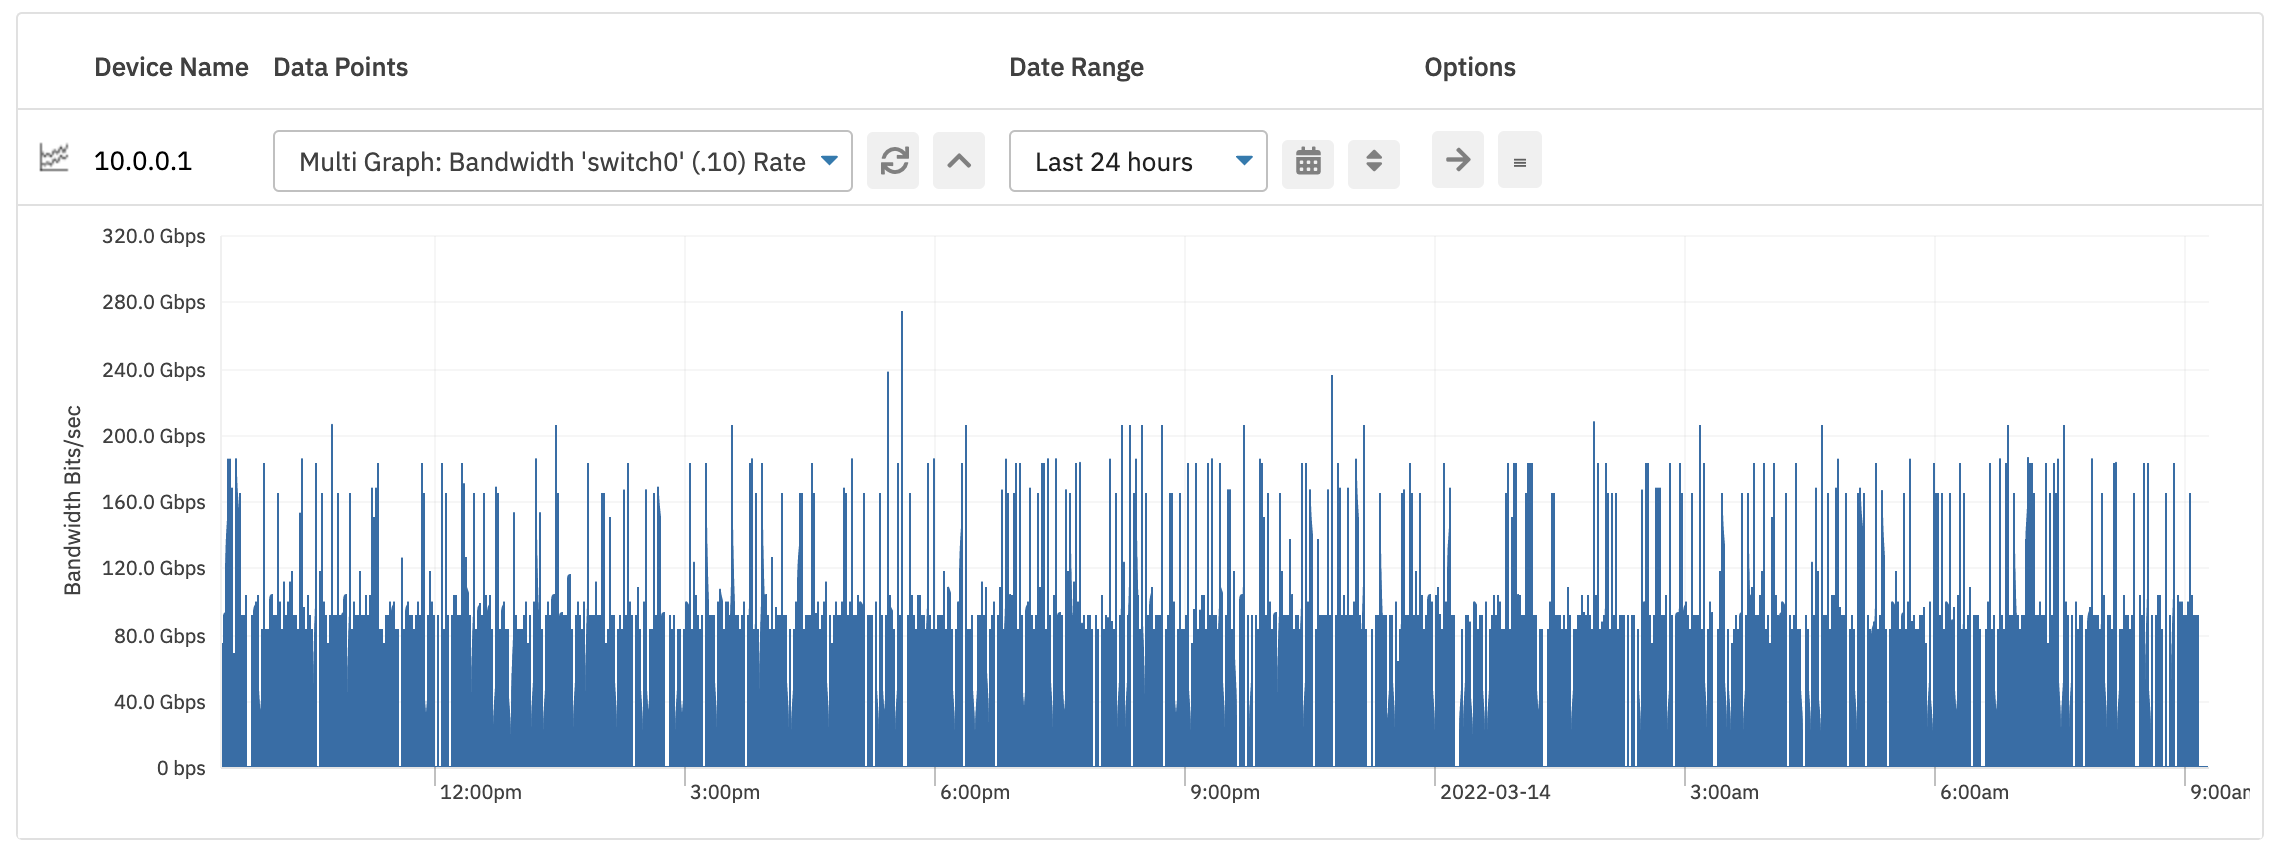
Next, select the device(s) you want to monitor and use the Save Changes button to create the event monitor. Let it run for a while and then in the graphs tab you can view long-term bandwidth trends.
Super Simple SNMP Bandwidth Monitoring
Get started with SNMP bandwidth monitoring by grabbing the FrameFlow 30-day evaluation version. In no time at all, you'll be collecting bandwidth metrics from your switches, routers, and other networking equipment.