This terminology tutorial serves as your dictionary of FrameFlow terms. Below, you will find a list of common phrases and what they mean in reference to the software.
The Headquarters section is the real-time hub for all your network devices. Here, you can see an up-to-date list of anything that may require your attention. The Headquarters section also allows you to suppress or resume alerts, so you can focus on the ones you need to deal with now and handle the rest later.
Dashboards show you a graphical view of the status and performance of your critical systems. Dashboards are entirely customizable to your needs, meaning you can add, remove, and create new panels of your choosing, to ensure you get the view of network operations that you need. This "single pane of glass" view is where you'll find a complete overview of system status.
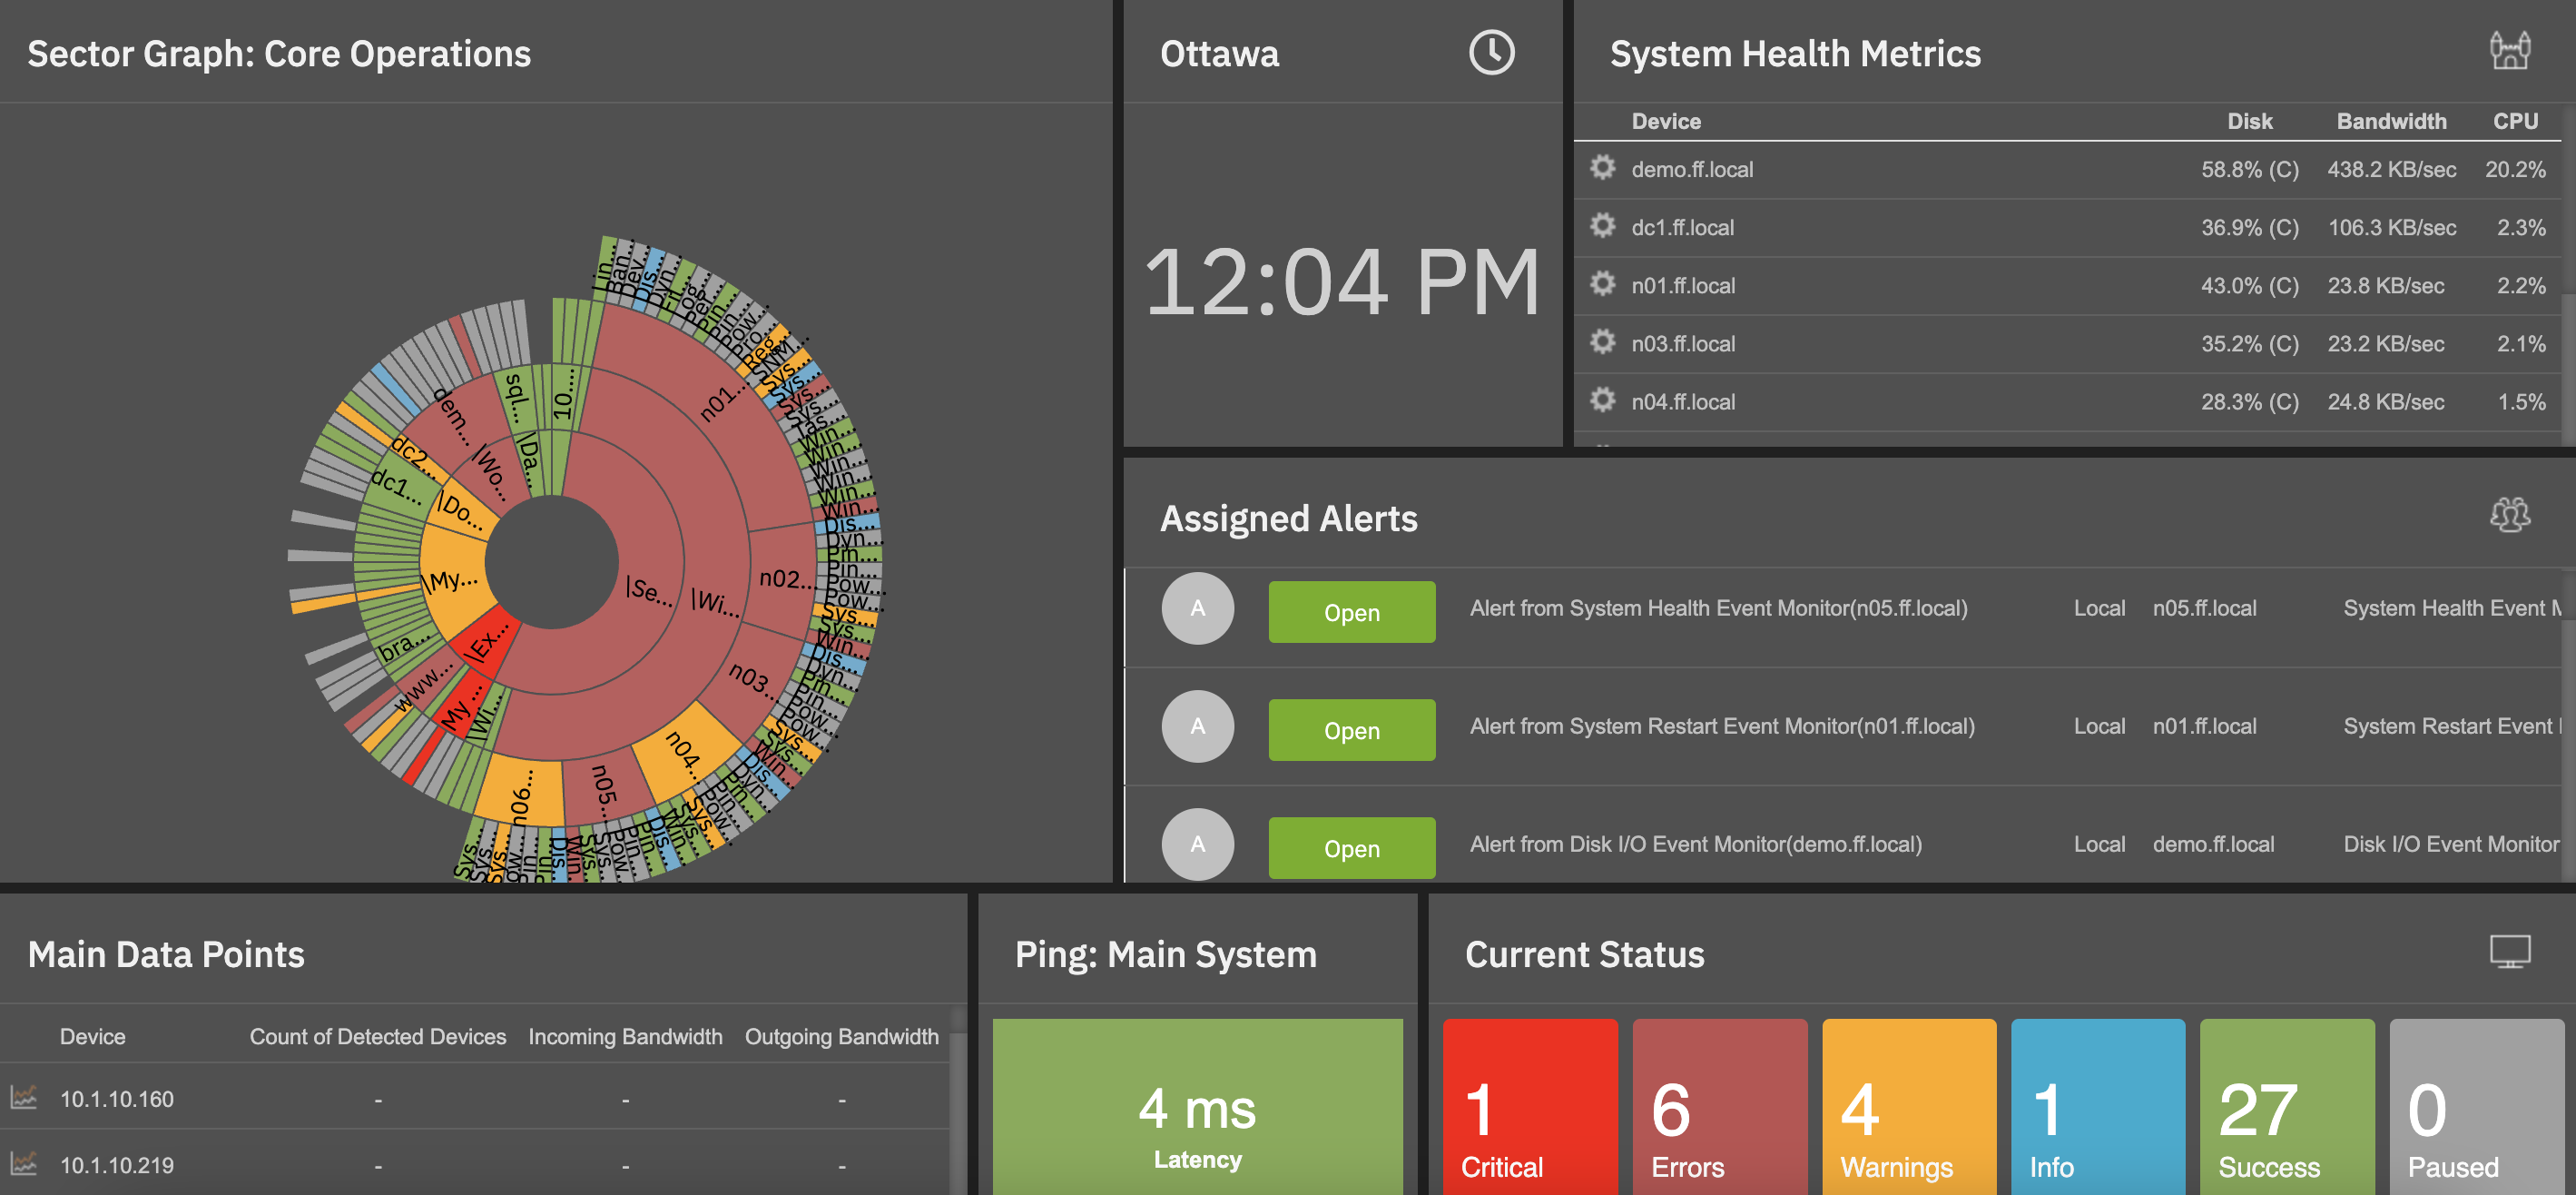 Dashboard Example
Network devices are servers, switches, routers, printers, and more. Any such device with an IP address can be monitored by FrameFlow. After adding your network devices to Frameflow, you can begin to monitor them and receive alerts about their status and current condition.
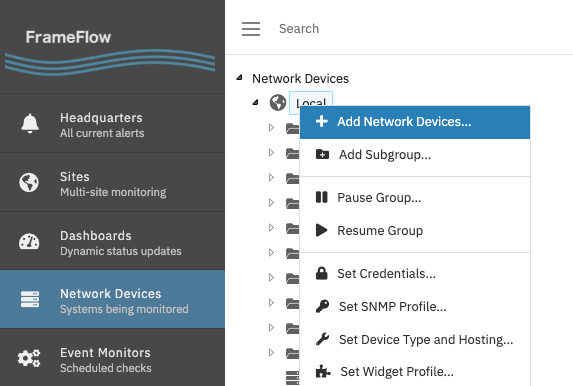 Adding Network Devices
Event monitors are tasks that run at regular intervals and test the health of your systems. You can set event monitors to measure bandwidth, connection speed, drive space, and more. There are over 100 kinds of event monitors, each designed to monitor specific conditions that may arise with all types of network devices.
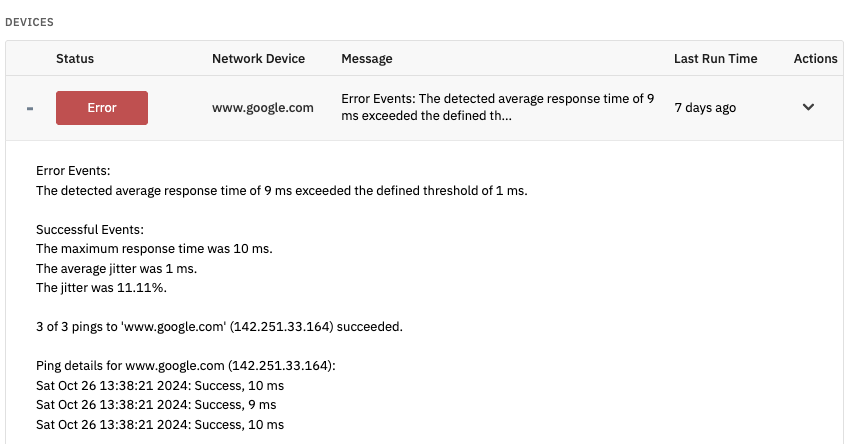 Ping Event Monitor Results
The event history section is where you'll find a list showing the results of event monitoring over time. This tool is useful for tracking the history of the performance of your network devices to understand the conditions that preceded an alert or decline in performance.
Tickets let administrators record/assign updates and configuration changes they made as they responded to alerts and monitoring results. This allows multiple system administrators to stay up to date on the latest system changes: who made them and why they happened.
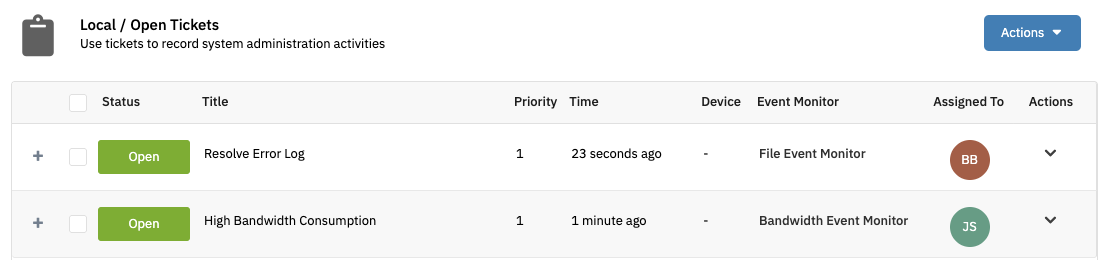 Ticket Entries
Reports provide a long-term view of network and system health. Changes made weeks or months ago can be tracked here to determine their overall effect. Reports provide graphs that lay out the long-term performance trends for your devices. Reports can be viewed within the FrameFlow interface or can be set up to go straight to emails.
FrameFlow is an agentless monitoring system. This means you never need to install anything on the systems being monitored. Instead, FrameFlow uses standard network protocols to connect to systems and retrieve monitoring data. To do this, it needs credentials to authenticate with the systems that will be monitored. An authentication profile is a set of credentials (username and password) that have been assigned a name. You can assign a profile to a device or an event monitor. If you need to change credentials, you can update the profile and all devices and event monitors using that profile will register the changes automatically.
Notification profiles let you define a collection of alerts and actions that will occur based on monitoring results. Examples include sending emails to one or more recipients, running scripts, writing to log files, or sending alerts via our telemetry service. You can customize who receives these alerts and at what level they are notified.
SNMP profiles are just like authentication profiles, but they are used for SNMP monitoring. With SNMPv1 and SNMPv2c, you can specify the community string used to connect to your network devices. With SNMPv3, you can specify credentials and encryption levels for the monitoring connection.
Maintenance window profiles are useful to suppress alerts for a period during which you know systems will be unavailable due to upgrades or other planned maintenance. You can define one-time maintenance windows, such as a two-hour period that occurs sometime in the future, or define recurring maintenance windows, such as every Sunday at midnight.
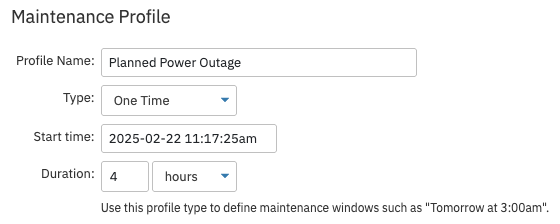 One-time Maintenance Window
Tags are informational items that you can assign to your devices or event monitors. They can be used for purely informational purposes, for example, defining a vendor or contact name for a particular. You can also use them for monitoring purposes, like setting an event monitor to check all devices that have a particular tag. For example, all devices tagged "laptop" can be organized in this way. You can also use tags to define who will be alerted when a particular check fails.
Telemetry is a free add-on service for your FrameFlow subscription that adds cloud-based alerting and a companion mobile app with push notifications. These notifications can come in the form of email alerts, texts, or automated voice calls straight to your cell phone, depending on your needs.
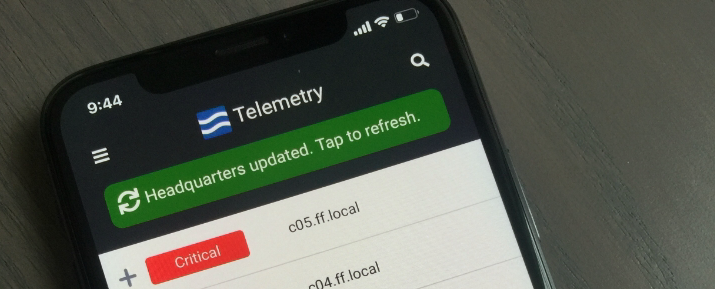 Telemetry App
In this tutorial, we introduced you to some of the important terms and terminology you will encounter while using FrameFlow to build your monitoring configuration. By becoming familiar with these terms, you will be able to navigate through the interface more fluidly.
More IT Monitoring Features