FrameFlow's CPU Usage Event Monitor tracks CPU usage on servers and workstations. This event monitor takes one or more samples of CPU usage and alerts if the average or maximum value exceeds specified thresholds. It can also focus on specific processes to alert if they are using too much CPU or memory. It will notify you including a list of the top processes by CPU usage in every notification. In this tutorial, we will teach you how to get the most out of the CPU Usage Event Monitor.
In the "Add Event Monitor" menu, select the CPU Usage Event Monitor and select your devices for monitoring. Below, you can change the settings for the event monitor. Set the number of times you would like the monitor to sample CPU usage and the time elapsed between each sample. These values can be averaged to give a more accurate view of CPU usage on any core.
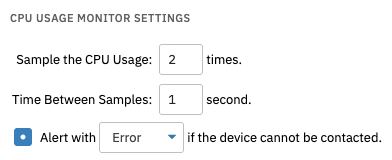 CPU Usage Sampling Options
The event monitor has options to specify info, warning, error, and critical thresholds for a host of CPU usage statuses. You can choose to be alerted if the average or maximum CPU usage passes a certain percentage for all cores being monitored. You can also choose to be notified when any one core reaches a certain level of CPU usage, dictated either by the average or the maximum. There is also an option to include the top ten processes using CPU in every notification.
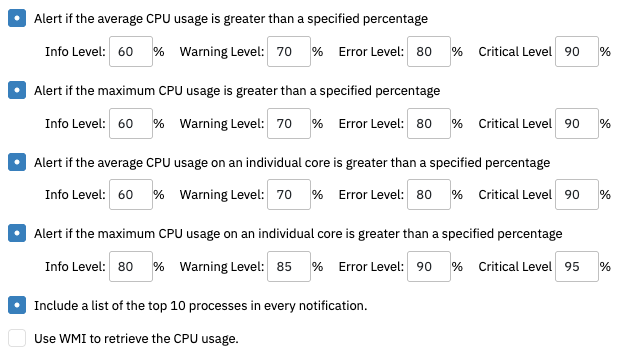 More CPU Usage Monitoring Options
By default, the CPU Usage Event Monitor uses Windows Performance Counters to retrieve data on CPU usage. You can change this by checking the box that says "Use WMI to retrieve the CPU usage". Note that WMI does not have access to the core values, so if you are using WMI to get your CPU usage data, the event monitor will not be able to separate CPU usage values by core. Ideally, you should use Windows Performance Counters and leave this box unchecked, but the option exists if there are problems monitoring that way.
With this last option explained, it's time to run your event monitor! You will notice that the results are separated into maximums and averages for each core, as well as overall.
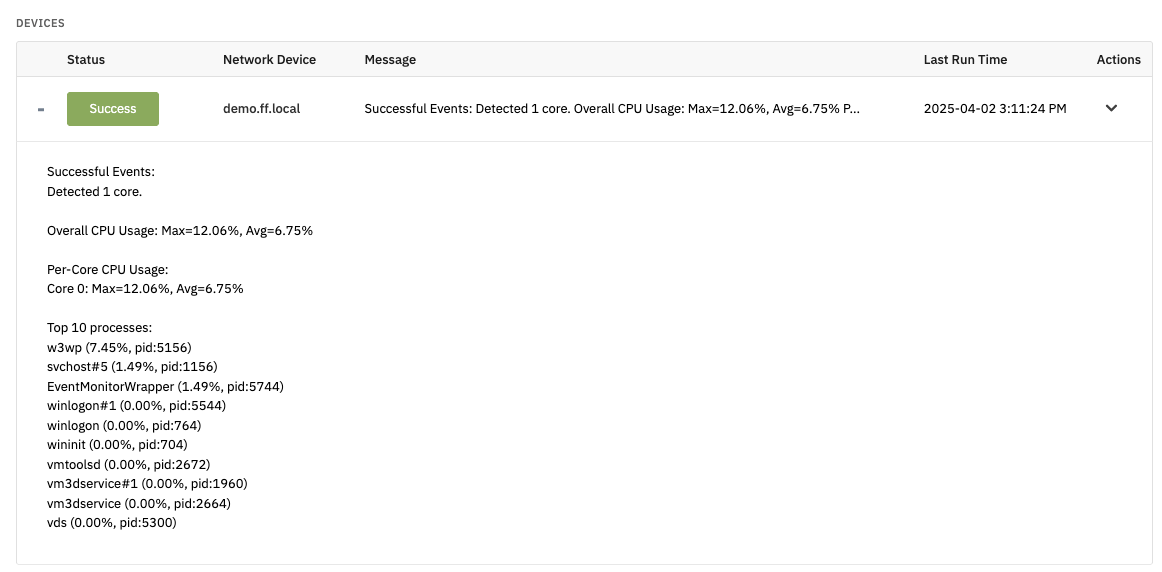 Successful Run of CPU Usage Event Monitor
With the CPU Usage Event Monitor, you can keep track of the programs that are eating up your CPU by core, or by the whole. In this tutorial, we showed you how to set the monitor up, as well as how to refine the settings to your liking. We also taught you what to do if Windows Performance Counters are working sub-optimally and gave you another option from which to retrieve data. Check out our Linux/SSH CPU Usage Event Monitor to learn more about Linux CPU usage monitoring specifically. Refer to our CPU Usage Event Monitor reference guide for more documentation on this event monitor. Keep an eye on the Features section of FrameFlow for more new content soon!
More IT Monitoring Features