The Network Device List panel and the Event Monitor List panel provide ordered lists of items that are in your monitoring configuration. The Network Device List panel showcases network devices in order of alert status. The Event Monitor List panel shows a list of your event monitors, also sorted by status. Read on to learn how to configure each panel and add them to your dashboards.
To begin, choose a title, subtitle, and icon for your Network Device List panel. Under "Show" and "Filter", you can choose which network devices will or will not appear in the list. By default, every network device will appear. Consider having a panel dedicated to paused devices only for an easy method of keeping track of them.
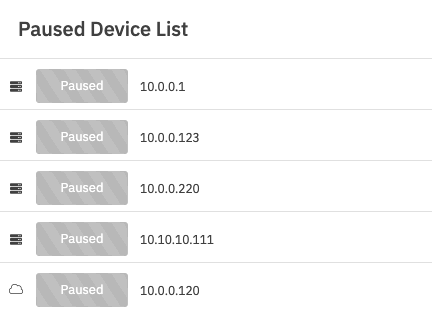 Network Device List of Paused Devices
Also by default, items on the Network Device List panel will be sorted by level of alert. If you prefer, you can have them ordered by name instead, but for most monitoring cases, you'll want them to be sorted by status.
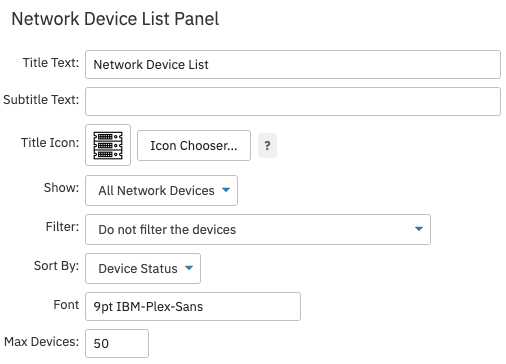 Network Device List Settings
Choose the font and the maximum number of devices that will be shown. Now you're ready to implement your new Network Device List panel in your existing dashboards!
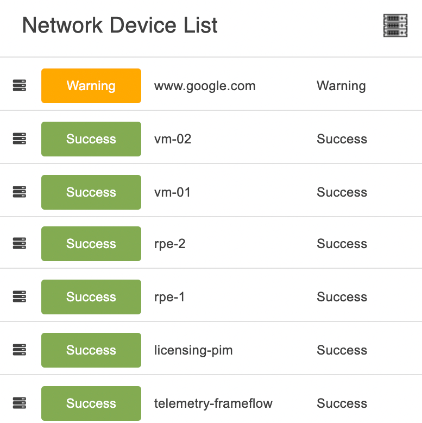 Completed Network Device List Panel
Event Monitor List Panel
The Event Monitor List panel operates in much the same way as the Network Device List panel. To begin configuring an Event Monitor List panel, choose a title, subtitle, and icon to use. Then, select which event monitors should appear in the list and which ones shouldn't.
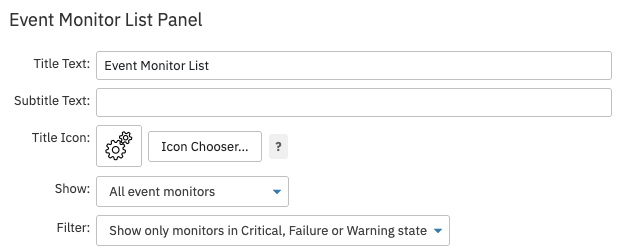 Event Monitor List Panel Settings
Under "Sort By", you can choose to view event monitors in order of status, in order of their names, or by the time they've spent in their current alerting state.
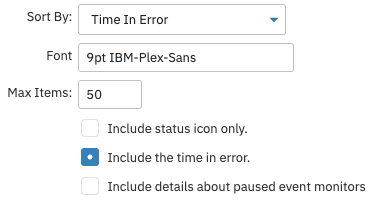 Additional List Panel Settings
Checking the box called "Include Time in Error" will include the time each event monitor has spent in an error state, regardless of whether or not you've chosen the above "Sort By" option. Including this information can help you decide which problem to tackle first when looking at your Event Monitor List panel. Choose the maximum number of event monitors to show in the list and you're ready to add your Event Monitor List panel to your dashboard.
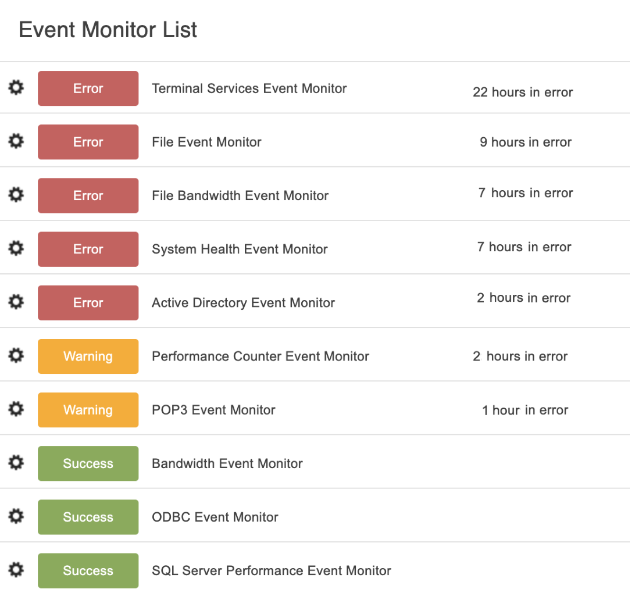 Completed Event Monitor List Panel
In this tutorial, we showed you how to set up and use the two different kinds of list panels: the Event Monitor List panel and the Network Device List panel. Make sure to visit our other Dashboards tutorials to learn how to create beautiful network diagrams, graphs, and more.
More IT Monitoring Features