The System Health panel gathers information from our System Health Event Monitor and displays it on an interactive dashboard. Every new installation of FrameFlow comes with a premade System Health dashboard that displays the health of your critical systems. This tutorial will show you how to create a new System Health dashboard panel from scratch and configure it to your specific needs.
The System Health dashboard panel updates each time the System Health Event Monitor does, giving your dashboard the latest information on the health of your critical systems, sorted by status.
Note that for the System Health dashboard panel to have somewhere to compile data from, you must first set up a System Health Event Monitor. This tutorial assumes that you have one or more functional System Health Event Monitors already up and running. To begin, right-click on your dashboard and add a System Health panel. Choose a title and icon.
 Adding a System Health Panel
Then, choose what network devices from which to obtain system health information. You have the option to gather information from all devices, but there are also options to be more selective of what devices you gather system health info from. Under "Metrics", you can choose which information to display on your System Health panel.
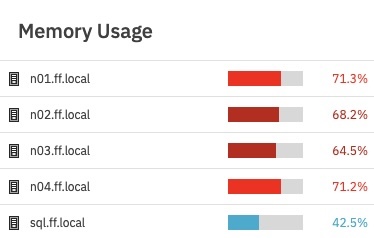 Single-Metric System Health Panel
The default System Health dashboard that comes with every installation of FrameFlow is a good example of how single-metric panels will look, but make sure to experiment with adding more than one metric to a panel. The panel is customizable to your needs so you can choose what metrics to display where. For panels containing more than one metric, the values returned by the event monitor will be color-coded in replacement of the colored bar used on the single-metric panel.
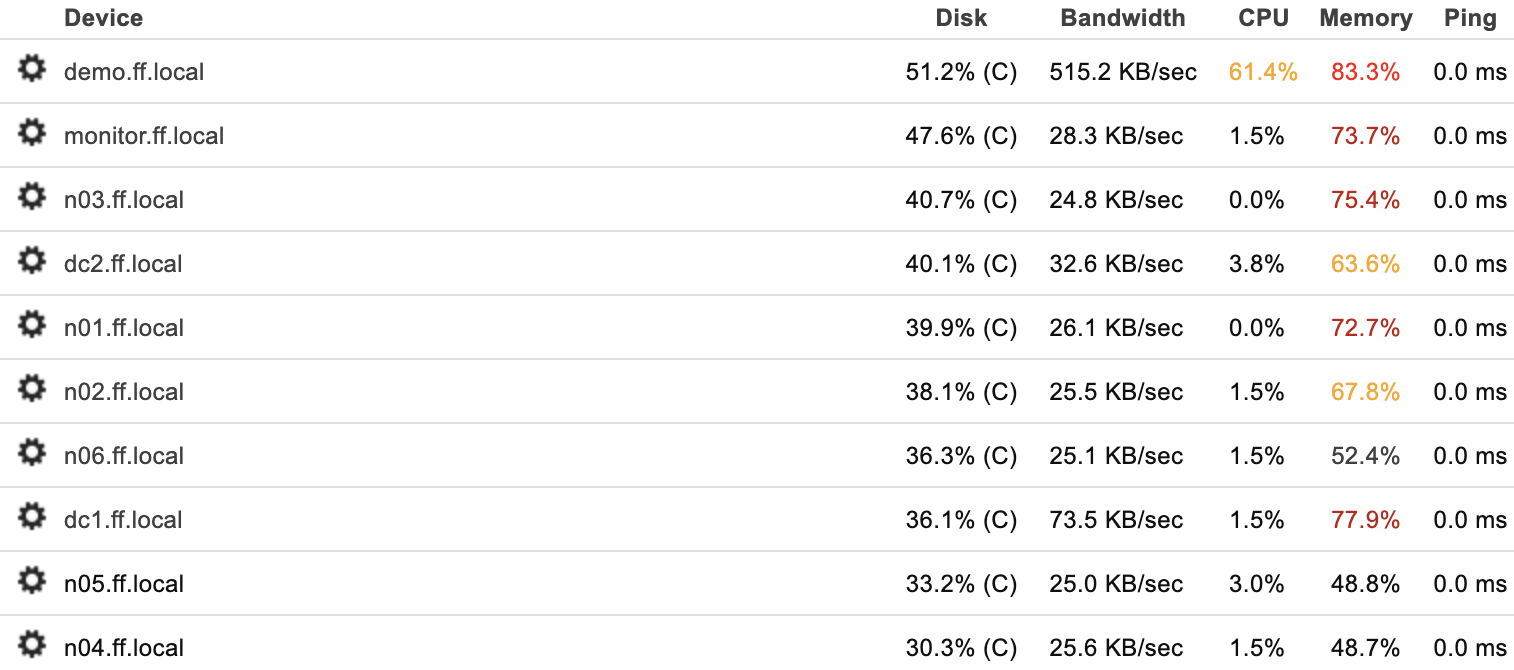 System Health Panel with Multiple Metrics
Next, choose sorting parameters, font, and the maximum number of items that will be displayed. Choose "Include column headers" for labels to be added to the top of each column. This helps qualify the information returned by the panel. Check the box titled "Don't include items in a success state" to display only the items in a non-success state.
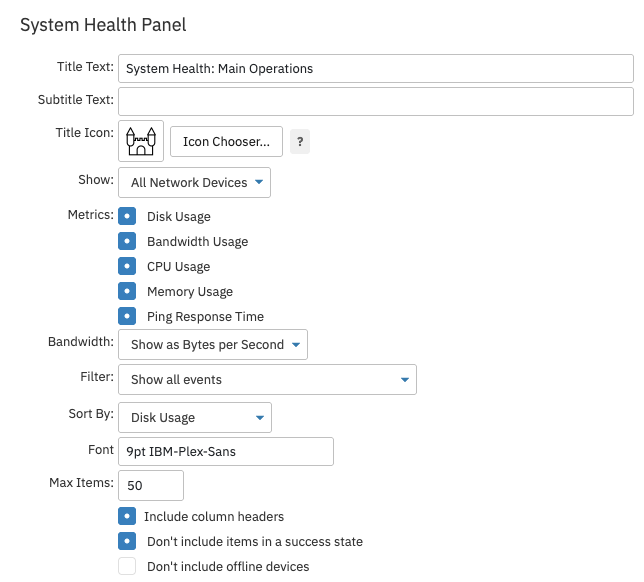 System Health Panel Settings
Finally, save your changes and watch the System Health dashboard panel populate with vital health information, now easily viewable on your dashboard. In this tutorial, we showed you how to display system health information on your dashboards using the system health dashboard panel. Now, you can view the important health metrics pertaining to your devices by simply checking your dashboard monitor. Make sure to check out our other dashboard tutorials in the Features section of our website!
More IT Monitoring Features