Dell iDRAC is a hardware/software interface that helps you deploy, monitor, and update your Dell servers. Our Dell iDRAC Event Monitor oversees the health of your iDRAC system's hardware and alerts you if something goes wrong. To monitor your HP iLO servers in much the same way, check out our HP iLO Event Monitor Tutorial for a list of that event monitor's features. In this tutorial, we will show you how to set up your new Dell iDRAC Event Monitor and tailor it to your company's specific needs.
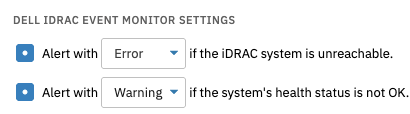
If your Dell iDRAC system is unreachable, the first option in the event monitor's Settings section will alert you with your choice of alert level. The option below this will notify you if the overall system health status of your iDRAC system is not OK. A value of "degraded" means that one or more system components have failed but the system as a whole is still functional. A value of "error" indicates a critical failure of one or more system components.
iDRAC Event Monitor Options
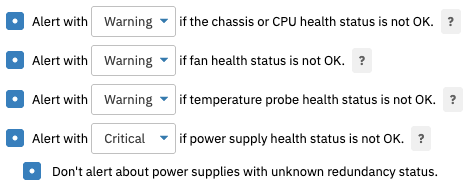
The next option lets you know if the chassis or CPU health status of your system is not OK. To be notified if this occurs, check the box and select the level of alert you prefer. You can also select an alert level for the health status of your iDRAC system's fans, temperature probe, and power supply. With the power supply alert option enabled, a new option appears called "Don't alert about power supplies with unknown redundancy status". Some systems' power supplies do not have a redundancy status, so if you're receiving unnecessary alerts about them, enable this option.
Other Options
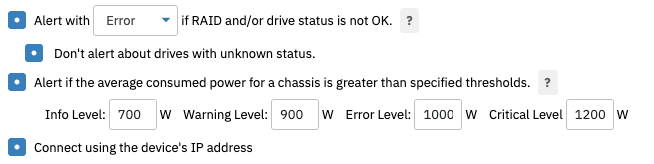
Included with the above options is an option to be alerted if the RAID and/or drive status is not OK. Select this option if you want to receive alerts if any physical or virtual disk's status is not OK. With this option enabled, another option is revealed which lets you omit alerts about drives with an "unknown" status.
The Dell iDRAC Event Monitor's final option lets you set thresholds for the average amount of power consumed by the server's chassis. It will alert you if the consumed power (measured in watts) has exceeded your specified thresholds. Data points from this option will be automatically graphed in the event monitor's Graphs section. Check back with these graphs after running the event monitor for a few weeks to track the average power your iDRAC system's chassis has consumed over time.
Chassis Power Thresholds
This tutorial taught you how to monitor your Dell iDRAC system with the Dell iDRAC Event Monitor. Now you can keep up to speed on vital aspects of your system's hardware such as fan status, system health, and average consumed power. Refer to our Dell iDRAC Event Monitor reference guide for more documentation on this event monitor. Keep an eye on the Features section of the FrameFlow website for new tutorials like this one dropping soon!
More IT Monitoring Features