The Oracle Event Monitor (similar to the SQL Server Event Monitor) checks your Oracle database servers for availability and runs SQL queries checking the results for specified values. In this tutorial, we’ll show you how to use it to keep your Oracle servers running smoothly.
The first thing to do when configuring your new Oracle Event Monitor is to choose the server(s) you want to monitor and enter the TNS service name in the provided field. To prep for this step, go to your Oracle server and enter a TNS entry in the tnsnames.ora file. This will by default be located in ORACLE_HOME\network\admin directory on Windows and the $ORACLE_HOME/network/admin directory on Linux/UNIX. This is the value that you’ll also enter in the TNS service name field within the Oracle Event Monitor.
Check the first box to be alerted if the event monitor cannot connect to your Oracle database server.
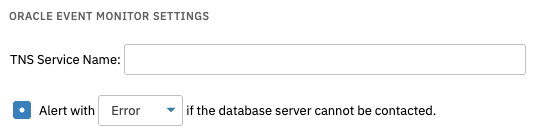 Connection Alert Settings
Check the next box to reveal a text box for your SQL commands. Enter your script in the provided box, then below you can select options that will parse the results as they come back. You can run multiple commands here, too, just separate different commands with a semicolon.
 Script Example
The first of such options lets you limit the number of result rows in your notifications to a specified number.
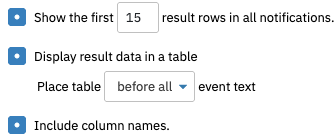 Result Row Options
The second option will give you an alert of your choice if a string of text that you specify is found in the results. Enter the text you want to watch out for and choose the number of rows and columns to check for said text.
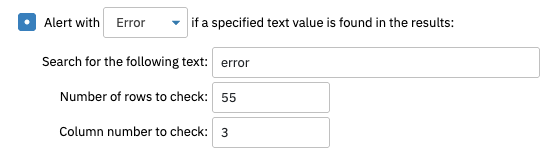 Text String Alert Example
You can also use the results from this event monitor to create incredibly customizable data points. You can select the label, comparison, value, alert level, and type of data you’re recording. To create another data point in the same Oracle Event Monitor, just click the "Add New Entry" button and repeat the above steps for your second, third, etc data point. Enter an asterisk in the "Rows" field to select all rows.
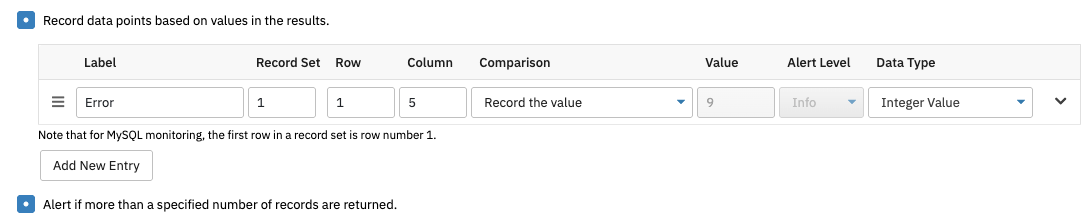 Datapoint Field (Grayed out areas aren't applicable)
Check the box labeled "Alert if more than a specified number of records are returned" to specify values that will trigger info, warning, error, and critical alerts.
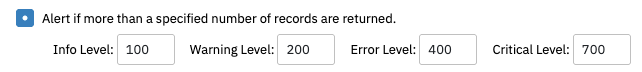 Limiting Returned Records
Similarly, the Oracle Event Monitor also has an option to alert if returning the data takes more than a specific span of time. You can set intervals for each level of alert in milliseconds.
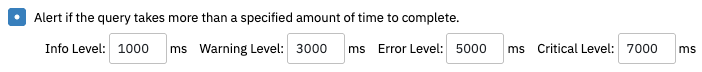 Time Specification Field
After you’ve configured these options to your liking, all that’s left is to specify connection and command timeouts. For most purposes, the default values the event monitor suggests should be sufficient.
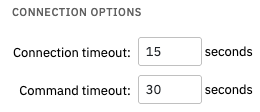 Connection Timeout Settings
In this tutorial, we taught you how to set up an Oracle Event Monitor to begin monitoring your Oracle database servers. We showed you how to configure the options as well as specify what the event monitor should do with the data that’s returned. Check out our SQL Server Event Monitor for instructions on how to use this similarly powerful event monitor. And don’t forget to keep an eye on the Features page for tutorials you’ve been waiting for! Refer to our Oracle Event Monitor reference guide for more documentation on this event monitor.
More IT Monitoring Features