The SQL Server Performance Event Monitor watches SQL Server performance counters such as the number of active transactions. It alerts based on the thresholds you set when configuring the monitor. This tutorial will teach you how to begin monitoring SQL Server performance with FrameFlow.
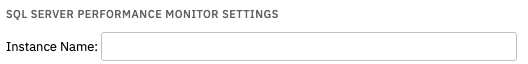
To begin, enter the name of the instance you're monitoring under "Instance Name".
 Instance Name Field
The first option alerts based on the number of requests per second to find a page in the buffer pool. You can set alert levels for values that are greater or less than expected.
 Page Lookups Counter
The next option indicates and alerts on the number of physical database page reads that are issued per second. This statistic displays the total number of physical page reads across all databases.
 Page Reads Counter
The third option indicates the number of physical database page writes that are issued per second. Set alerting levels for values that are greater or less than the values expected.
 Page Reads Counter
Next, indicate the number of active transactions that will trigger each level of alert.
 Active Transactions Counter
You can also set alerting parameters for the number of transactions started per second.
![]() Transactions Per Second Counter
Transactions Per Second Counter
The same option is also available for the number of logins started per second.
 Logins Per Second Counter
You can also monitor logouts per second in the same way.
 Logouts Per Second Counter
The next option lets you choose the number of user connections per second that will trigger each level of alert.
 User Connections Per Second Counter
The option after that alerts based on the average amount of wait time (in milliseconds) for each lock request that resulted in a wait.
 Lock Wait Time Counter
The option to alert based on "MSSQL:Locks: Number of Deadlocks/sec" controls alerting parameters for the number of lock requests per second that resulted in a deadlock.
 Lock Request Per Second Counter
The next option counts and alerts based on the number of SQL compilations per second.
 Compilations Per Second Counter
Similarly, the option to alert based on "MSSQL:SQL Statistics: SQL Re-Compilations/sec" alerts based on the number of re-compilations per second.
 Re-Compilations Per Second Counter
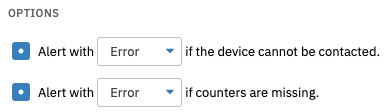
Under "Options", choose what level of alert you want to receive if the event monitor cannot connect to your device. Then, choose a level of alert to receive if counters are missing when the event monitor runs.
 More Options
This tutorial taught you how to configure a SQL Server Performance Event Monitor. Make sure to check out our SQL Server Event Monitor for more SQL Server compatibility. To view more documentation about this event monitor, view its Technical Resources page.
More IT Monitoring Features