The VMware Host Health Event Monitor keeps track of various metrics and performance values for your VMware hosts. In this tutorial, we'll go over all of its features and provide some use cases. First of all, use the device chooser to select the VMware hosts you'd like to monitor.
The first checkbox, when selected, lets you know if the device cannot be contacted.
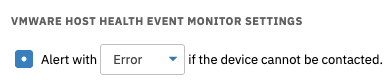 Connection Alert Option
The next checkbox, when expanded, provides fields to input percentages of CPU usage that will trigger each alert level: info, warning, error, and critical. This option monitors for CPU usage at the time of the event monitor's run. To get the most out of many of these options, let the event monitor run for a few cycles without the fields filled in. The data returned to you after these first few runs will give you a feel for what is normal for your particular host.
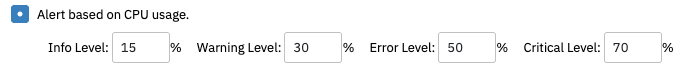 CPU Usage by Percentage
The option to alert if CPU readiness exceeds specified percentages measures the readiness of all guests on the host box. An ideal readiness percentage is zero, which indicates that the host has always had enough CPU to meet the demands of all virtual machines contained therein. The lower the number, the better. Enter percentages of CPU readiness that will trigger each alert level. As a rule of thumb, a 5% ready value per virtual computer is considered acceptable.
 CPU Readiness by Percentage
The next option is similar but alerts based on time thresholds instead. Set the ready time in milliseconds that will trigger each level of alert.
 CPU Readiness by Time
You can also choose to be alerted based on the host's disk space. Enter percentages for each alert field to be notified if the total disk space used exceeds those percentages. Check the box labeled "Ignore Selected Datastores". A text field will appear below where you can enter the names of datastores to ignore, separated by commas and named according to what they're called in the VMware interface.
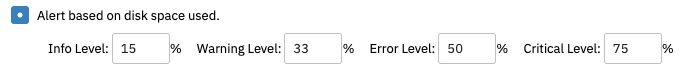 Disk Space Alert Option
The next option alerts based on the percentage of used memory consumed by the system.
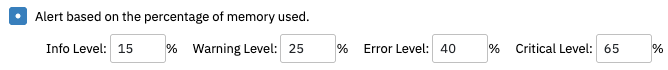 Memory by Percentage
The option below this reports instead on active memory, which is memory that's been touched by I/O operations within the last 20 seconds. Alerts are triggered based on a value, not a percentage.
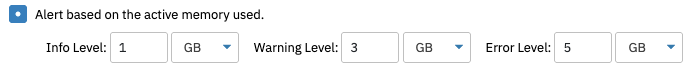 Active Memory by Amount
You can use the next option to send a ping check to the host each time the event monitor runs. While this could also be accomplished with our Ping Event Monitor, we've included the option here as well.
 Ping Check Option
The final three options of the VMware Host Health Event Monitor watch the bandwidth rates of your host machine. This event monitor can keep track of incoming, outgoing, and total bandwidth rates and alert based on thresholds you specify for each.
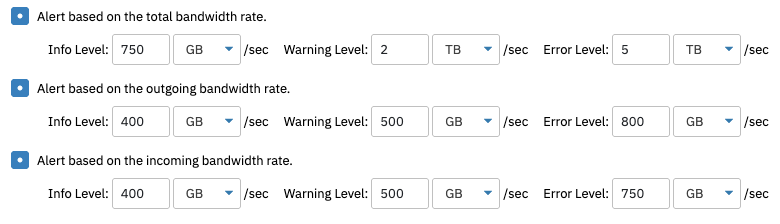 Host Bandwidth Alerting Options
Underneath the VMware Host Health Event Monitor's options, there's a textbox to input the names of hosts you'd prefer the event monitor to skip over when it runs. When entering values here, make sure to separate different values with commas.
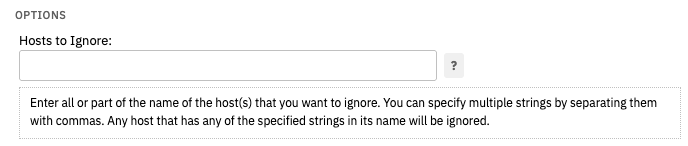 Hosts to Ignore Field
In this tutorial, we showed you all the features available to the VMware Host Health Event Monitor. Make sure to check out our related event monitors for ping response time and bandwidth rates. Also, don't forget to keep an eye on our Features page for new and exciting tutorials coming soon! Refer to our VMware Host Health Event Monitor reference guide for more documentation on this event monitor.
More IT Monitoring Features