The MySQL Event Monitor checks any MySQL database and runs SQL statements. It then shows the results retrieved and alerts based on values found in the results. This tutorial will teach you how to use it and why you may want to add it to your existing monitoring configuration.
To begin, you'll need to enter the driver version. If you haven't already, this will require you to install the MySQL ODBC driver on the FrameFlow server. After you've installed it, copy the version string from the driver so the MySQL Event Monitor knows which version to use. Enter the port number, which will usually be the value already included in the event monitor unless it's been changed.
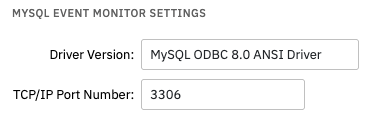 Driver Version and Port Number Fields
As always, you can choose your preferred level of alert to receive if the event monitor cannot connect to the server.
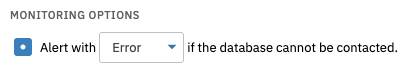 No Contact Alert Option
The next two options let you specify database sizes that will trigger alert notifications. You can set thresholds for size that will apply to every database as well as thresholds that apply to specific databases only. You also have the option to include the size of every database in your notifications each time the event monitor runs.
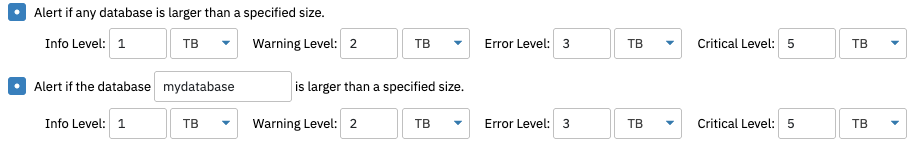 Database Size Settings
You can also run a SQL statement within the event monitor itself. Enter your script in the provided box, then below you can select options that will parse the results as they come back.
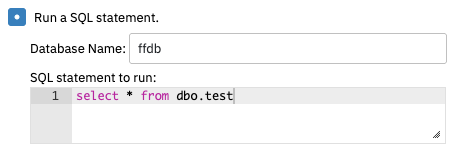 SQL Command Example
You can choose the number of result rows that will be shown in each notification with the first option.
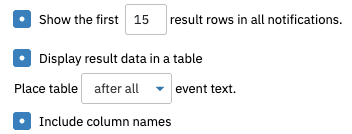 Result Row Field
The second option lets you input a string of text that will trigger alerts if found in the results when the SQL statement runs. Input the string of text and the number of the recordset, result rows, and columns that you want to be checked.
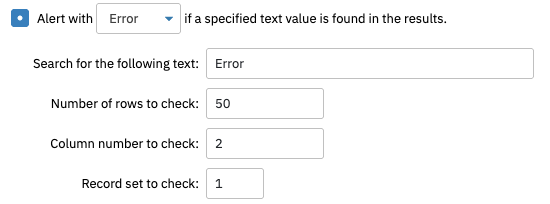 Text String Fields
Values found in the results can also be used to create data points using the form below:
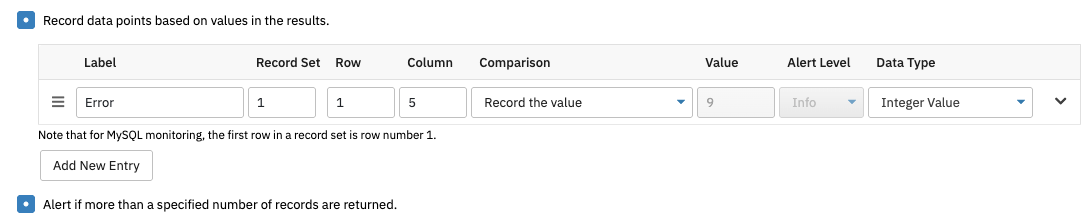 Datapoint Example
The next two options deal with the number of results returned and the amount of time it takes to return those results. Check the box labeled "Alert if more than a specified number of results are returned" and enter the numbers of results that will trigger each alert level. The option below this lets you input spans of time that, when exceeded, will trigger each level of alert as well.
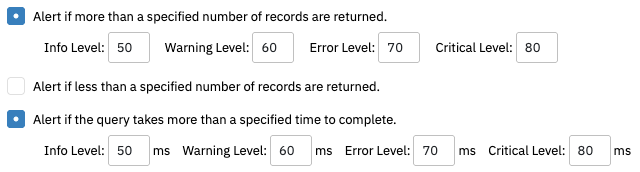 Returned Results and Time Taken Options
The final option is where you can specify connection and command timeouts. Usually, the default values will work for you, but the option exists to change them.
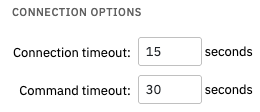 Connection Settings
In this tutorial, we showed you how simple it is to monitor MySQL with FrameFlow. Make sure to check out our similar Oracle Event Monitor and SQL Server Event Monitor, which help you to monitor other kinds of databases. Don't forget to keep an eye on our Features page for more handy tutorials. Refer to our MySQL Event Monitor reference guide for more documentation on this event monitor.
More IT Monitoring Features