The AD Discovery Event Monitor searches Active Directory to add newly found systems to your monitoring configuration. Use it to save time that would otherwise be consumed by onboarding devices by hand. This tutorial will teach you how to set up your first AD Discovery Event Monitor and begin the automation process.
This event monitor is similar to our Ping Discovery Event Monitor, which also automatically adds network devices but uses ping requests instead.
When searching the "Add Event Monitor" menu in your FrameFlow installation, search for "AD Discovery Event Monitor" to ensure you find the correct event monitor. Once you've added it as usual, it's time to configure the settings.
The first step is to add the hostname or IP address of the domain controller you'd like to use. Remember: the authentication profile you'll choose later must have access to the domain controller you have selected.
 Hostname Settings
Next, enter the search base or query that will be used to search the Active Directory. For example, if you wanted to search the frameflow.local site, you'd input "DC=frameflow,DC=local".
 Domain Controller Settings
Just like in the Ping Discovery Event Monitor, you can preselect the folder that new devices will automatically be added to. You may consider creating a new folder specifically designated for these new devices so you can oversee what's being added and decide where they should ultimately go. To learn more about adding your devices to groups and subgroups, check out our Network Device Organization tutorial.
 Folder Chooser
You can customize how you would like the event monitor to name devices as they're added to your monitoring configuration. All five naming convention options are shown below:
 Naming Format Options
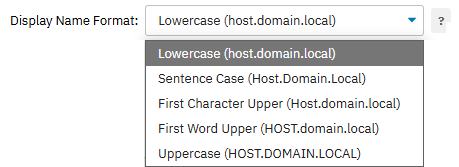
If you'd like the names of devices to be displayed differently than they are internally, you can also specify display names for your devices.
 Display Name Options
Under Tag Discovery, you can add the tags you want to be associated with this event monitor. Tags help you categorize and organize your event monitors. You can also use them to insert additional information in alert notifications by editing your existing notification templates in the Settings section. For more info on monitoring by tag, check out our tutorial on the topic.
 Tag Discovery Section
The first option in this section lets you choose what alert you'll receive if the domain controller cannot be contacted.
 Domain Controller Connection Option
The second option in this section lets you receive an alert of your choice if a previously-discovered device is no longer found in Active Directory.
 Previously Discovered Device Option
Under this category, there are three different options to choose what to do with devices that are no longer found in Active Directory. You can pause, remove, or move these devices into a folder that you specify.
 Device Sync Options
If a computer is marked as disabled in Active Directory, the AD Discovery Event Monitor will pick it up anyway. If you do not want disabled computers to be added to your monitoring configuration, select the option to "Skip computers marked as disabled".
 Skip Disabled Computers Option
The final two options let you filter devices by their attributes. Enter a comma-separated list of values and attributes that you want to include or exclude from monitoring.
 Attribute Filters
As mentioned above, you'll need to select an authentication profile that has access to the domain controller you plan to use with this event monitor. Different domain controllers will require different levels of access, so the authentication profile you'll need to use will also vary. If you have any problems authenticating, please feel free to contact FrameFlow's technical support.
 Authentication Profile Chooser
In this tutorial, we showed you how to set up an AD Discovery Event Monitor. We showed you how to automate the addition of new devices and make sure they end up in the right place once added. We also mentioned what kind of authentication you may need to run this event monitor. Keep an eye on the Features page of FrameFlow's website for related tutorials like the Ping Discovery Event Monitor and the SNMP Discovery Event Monitor. Refer to our AD Discovery Event Monitor reference guide for more documentation on this event monitor.
More IT Monitoring Features